
Seasonal trading patterns are predictable price movements tied to specific times of the year, influenced by factors like weather, consumer behavior, and institutional cycles. These patterns can help traders identify high-probability entry and exit points, offering a structured approach to trading across stocks, commodities, forex, and even cryptocurrencies.
Key takeaways:
- Seasonal trends are based on historical averages, not guarantees, and require rigorous backtesting.
- Examples include the "Sell in May" strategy, the Halloween Effect, and holiday-related trends like the Santa Claus Rally.
- Tools like technical indicators and historical data analysis help confirm these patterns.
- Risk management is critical: limit trade risk to 1–2% of account value, diversify across patterns and assets, and aim for a minimum reward-to-risk ratio of 2:1.
To succeed, combine seasonal insights with technical tools, validate strategies with data, and maintain disciplined execution. Platforms like MillionMachine can simplify research and testing, ensuring your strategies are well-grounded and statistically reliable.
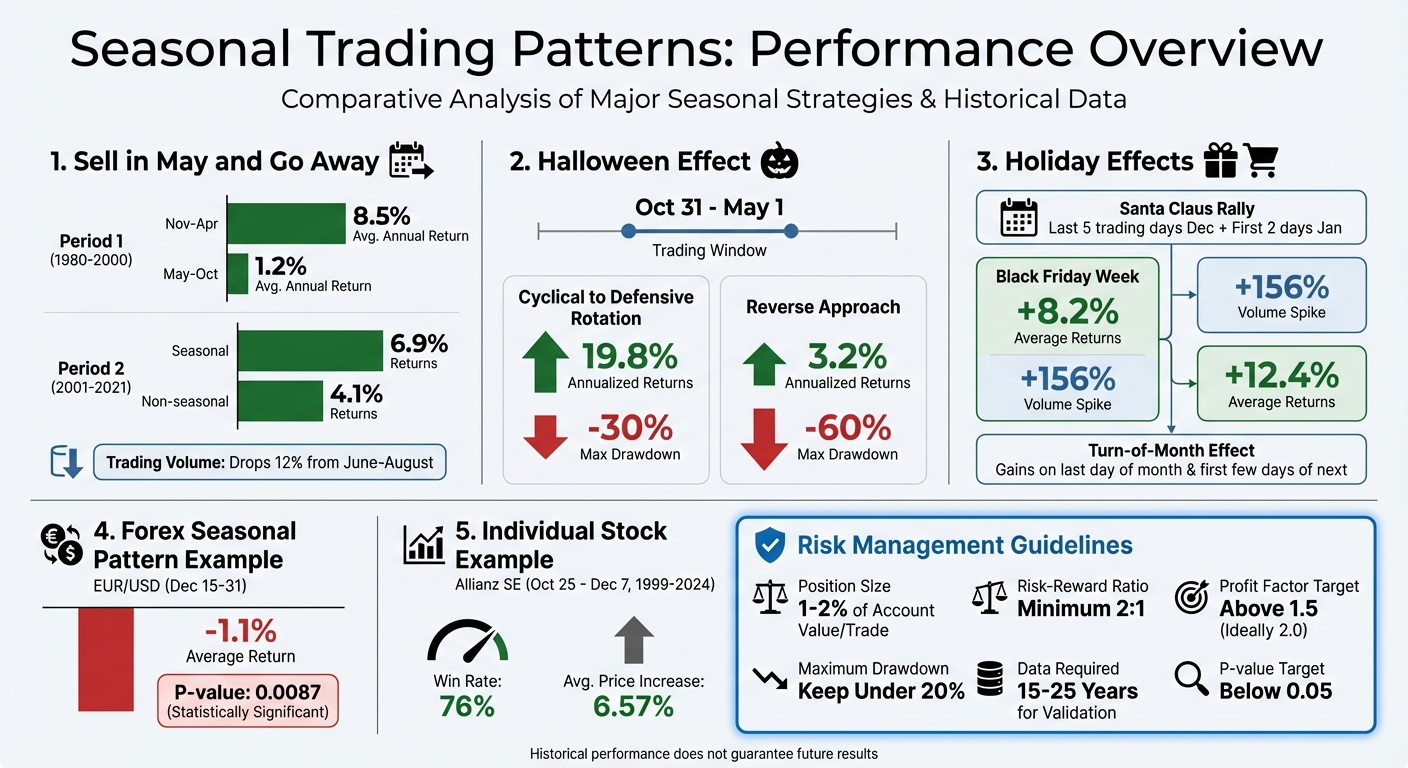
Seasonal Trading Patterns Performance Comparison: Key Strategies and Historical Returns
Common Seasonal Trading Strategies
Sell in May and Go Away
This strategy involves reducing or exiting equity positions in May and stepping back into the market in November. Why? Historically, summer months have underperformed compared to the winter period. For instance, between 1980 and 2000, the November–April stretch delivered an average annual return of 8.5%, while May–October lagged significantly with just 1.2% returns. Even in more recent years (2001–2021), the seasonal period outperformed, delivering 6.9% returns compared to 4.1% during the non-seasonal months.
Instead of completely pulling out of the market, many traders shift their focus to defensive sectors like Health Care (XLV), Utilities (XLU), and Consumer Staples (XLP), while trimming exposure to more cyclical sectors like Technology (XLK) and Consumer Discretionary (XLY). Additionally, trading volume typically drops by about 12% from June through August, often leading to choppier price movements. Another seasonal approach takes advantage of specific calendar dates, as we’ll explore next.
Halloween Effect
This strategy zeroes in on a six-month cycle, with traders buying stocks on October 31 and holding until May 1. Historically, this winter period has outperformed its summer counterpart, with the October–December stretch showing particularly strong gains. For example, between 1999 and 2018, a strategy that rotated from cyclical to defensive sectors during this window achieved annualized returns of 19.8%, with a maximum drawdown of –30%. By contrast, the reverse approach yielded just 3.2% returns with a much steeper –60% drawdown.
To refine their trades, many traders pair this seasonal strategy with technical indicators. Tools like the MACD help confirm trends, while RSI can fine-tune entry points. Beyond these broader seasonal patterns, market behavior also shifts around specific holidays and days, leading to more targeted strategies.
Holiday and Day-of-the-Week Effects
Markets often follow predictable patterns tied to holidays and specific days of the week. For example, Fridays tend to see positive returns as investors position ahead of the weekend, while Mondays often underperform due to the accumulation of negative news over the weekend. One of the most well-known holiday effects is the Santa Claus Rally, which typically boosts stock prices during the last five trading days of December and the first two of January. This rally is fueled by year-end optimism and "window dressing", where fund managers add top-performing stocks to polish their year-end portfolios.
Another noteworthy pattern is the turn-of-the-month effect, where markets often climb on the last day of one month and the first few days of the next. This is largely attributed to automated retirement contributions and institutional portfolio rebalancing.
In the retail sector, Black Friday week has historically seen average returns of +8.2%, accompanied by a 156% spike in trading volume. Cyber Monday tends to perform even better, with returns averaging +12.4%. In forex markets, seasonal patterns also emerge. A 25-year backtest of shorting EUR/USD between December 15 and December 31 revealed an average return of –1.1%, with a statistically significant P-value of 0.0087. These predictable patterns provide traders with opportunities to capitalize on market behavior during specific times of the year.
Tools and Methods for Identifying Seasonal Patterns
Technical Indicators for Seasonal Analysis
Technical indicators don’t directly uncover seasonal patterns – they’re more about confirming when a seasonal trend is active. For example, the MACD is excellent for verifying if a trend has genuinely started during a seasonal window. Meanwhile, momentum indicators like RSI and Stochastics are handy for identifying precise entry and exit points, helping traders avoid jumping in too early or too late within a seasonal period.
Volume analysis plays a vital role here. A spike in trading volume – above the average – signals genuine market participation rather than random fluctuations. The Bullish Percent Index, especially when paired with a 15-day moving average, can further validate the broader trend during seasonal transitions. The key takeaway? Don’t rely solely on dates; combine calendar-based patterns with technical tools for confirmation.
And remember, technical indicators work best when paired with solid historical data to validate these seasonal trends.
Using Historical Data
After technical indicators identify a potential seasonal window, historical data steps in to confirm its reliability. To separate real patterns from randomness, you need 15 to 25 years of data. This range covers various market conditions – bull and bear markets, recessions, and recoveries – offering a clearer picture of whether a pattern holds up over time. For instance, from 1999 to 2024, Allianz SE exhibited a consistent seasonal pattern with a 76% win rate between October 25 and December 7, averaging a price increase of 6.57% during that period.
Statistical validation is essential for distinguishing genuine trends. Tools like T-statistics and P-values (aiming for values below 0.05) help determine whether a seasonal return is statistically significant or just random chance. Another method, permutation testing (also known as Monte Carlo analysis), runs thousands of randomized simulations. For example, a 25-year backtest of the EUR/USD pair revealed an average return of -1.1% between December 15 and December 31. A permutation test with 10,000 simulations showed this drop was random only 0.87% of the time (P-value = 0.0087), proving its significance.
To avoid overfitting, always split your data into "In-Sample" and "Out-of-Sample" periods. Use the in-sample data to identify the seasonal window, then test it on out-of-sample data to ensure the pattern holds up in unseen conditions. Additionally, compare seasonal returns against non-seasonal periods and random benchmarks of the same duration. If the edge vanishes when you shift the dates, it’s likely not a genuine seasonal pattern. This rigorous approach ensures your analysis is grounded in reality, not coincidence.
How to Implement Seasonal Trading Strategies
Research and Backtesting
Before diving into live trading, it’s crucial to confirm your seasonal strategy has real potential. Start by defining a clear hypothesis. This means specifying the asset, identifying the seasonal window (e.g., October 27 to December 31), setting precise entry and exit rules, and choosing a benchmark for comparison. For example, instead of a vague idea like "trade gold in winter", you might outline: "Buy gold on September 1 and sell on February 28, comparing returns to a buy-and-hold approach."
Gather historical data spanning 20–25 years to identify monthly or quarterly patterns. This timeframe captures a variety of market conditions, including bull and bear markets, recessions, and recoveries. Without enough data, your backtest risks being unreliable since it won’t have sufficient independent observations for meaningful statistical analysis.
Run a comparative analysis by testing your seasonal window against non-seasonal periods and random time frames of the same length. Use statistical tests like T-statistics or permutation testing to ensure your results aren’t just random noise. Aim for a P-value below 0.05 to demonstrate statistical significance. Split your data into In-Sample (used for developing the strategy) and Out-of-Sample (used for testing unseen data). Success with Out-of-Sample data is a strong indicator that your strategy isn’t simply overfitted to historical trends.
Consider using tools like MillionMachine to visually design strategies, conduct robust backtests, and check for overfitting. Its optimization features can help fine-tune parameters, while performance analytics reveal if your seasonal edge holds up under scrutiny.
Creating and Executing a Trading Plan
Once you’ve validated your backtest, it’s time to create a detailed trading plan. This plan should outline everything – entry dates and times, exit criteria (including time-based and stop-loss levels), position sizing, and risk controls. Seasonal strategies demand precision, as even small delays in execution can erode your edge.
Control your risk by sizing positions so that no single trade risks more than 1% to 2% of your account balance. For instance, if your account totals $50,000, you should limit your risk to $500–$1,000 per trade. Use your stop-loss distance to calculate position size and aim for a risk-reward ratio of at least 2:1.
Whenever possible, automate your trade execution to reduce the impact of emotions. Platforms with calendar alerts or webhook integrations can trigger trades at pre-set times. Additionally, keep a detailed record of each trade to build an audit trail for future analysis.
Monitoring and Adjusting Strategies
After executing your strategy, compare its live performance to your backtested results to ensure alignment. Consistently track metrics like win rate (targeting 55% to 65%), profit factor (aiming for above 1.5), and maximum drawdown (keeping it under 20%).
Keep in mind that market dynamics evolve. A seasonal pattern that worked from 1980 to 2000 may weaken due to factors like changes in tax laws, the rise of automated trading, or broader economic shifts. To stay ahead, implement walk-forward analysis by updating your backtests with fresh data regularly. This ensures your seasonal patterns remain valid. If your strategy consistently underperforms over multiple cycles, it might be time to re-assess and incorporate additional filters, such as volatility measures or macroeconomic indicators.
Adjust position sizes based on performance but avoid overreacting to short-term fluctuations. MillionMachine’s performance analytics can help you compare current results with historical benchmarks, making it easier to identify whether underperformance is due to structural changes or normal market variance.
Risk Management in Seasonal Trading
Position Sizing and Stop-Loss Strategies
When trading seasonally, one of the most effective ways to manage risk is by applying the 1% rule. This means limiting your risk on any single trade to no more than 1% of your total account balance. For example, if your account size is $50,000, your maximum risk per trade would be $500. Some traders may stretch this to 2% in specific situations, but sticking to a more cautious approach can shield your account from significant losses if a trade doesn’t go as planned.
Your position size should be determined by your stop-loss level. Let’s say you’re buying a stock at $100 and setting a stop-loss at $95 – that’s a $5 risk per share. With a $500 risk limit, you could buy 100 shares. For physical commodities, like those tied to harvest cycles, larger allocations might make sense compared to speculative equity patterns.
When placing stop-losses, it’s important to allow for some market noise. Technical stop-losses are useful when placed just beyond key support or resistance levels, as this invalidates your seasonal thesis if breached. Alternatively, volatility-adjusted stops can help you avoid being prematurely stopped out during volatile periods. For instance, if a stock’s daily movement increases from 2% to 4%, your stop-loss should account for this wider range.
Timing is another critical factor. Use time-based exits to close positions when the seasonal window ends. For example, if you’re following a "Sell in May" strategy, exiting by early May makes sense since the historical advantage diminishes after that point. Trailing stops can also lock in profits by moving your stop-loss to break-even or better as the trade progresses.
These stop-loss methods pair well with diversification strategies, ensuring individual trades don’t put your account at undue risk.
Diversification Across Patterns and Assets
Seasonal trading can be unpredictable, so spreading risk across different patterns and asset classes is essential. Diversifying among multiple seasonal patterns that peak at different times can help smooth returns over the year. For example, blending strategies like the Santa Rally in December, a "Sell in May" approach, and fall commodity harvest plays can reduce the impact of any single pattern underperforming.
Additionally, cross-asset diversification offers another layer of protection. A study spanning 1999 to 2018 highlighted how a cyclical-to-defensive sector rotation strategy yielded 19.8% annualized returns with a -30% maximum drawdown, compared to just 3.2% returns and a -60% drawdown for the reverse approach. By combining equity patterns with agricultural commodities, foreign exchange trends, or precious metals, you can balance losses in one area with gains in another.
To avoid overexposure, set concentration limits for individual patterns or events. Even if a seasonal trend like the January Effect has historically performed well, it’s wise to cap the amount of capital you allocate to it. Also, watch out for correlations – assets like heating oil and natural gas often move together seasonally, so holding both might not provide true diversification.
Lastly, use volume confirmation to validate your trades. Only enter patterns supported by above-average trading volume, as this reduces the chance of being caught in random market fluctuations. For example, trading volume typically drops by about 12% during the June–August period, so you might want to reduce exposure or tighten position sizes during these months, even for otherwise reliable patterns.
Once your portfolio is diversified, maintaining favorable reward-to-risk ratios becomes the cornerstone of your strategy.
Reward-to-Risk Ratios
Your reward-to-risk ratio plays a big role in long-term profitability, even if your win rate is modest. Aim for a minimum ratio of 2:1 – for every $1 you risk, target at least $2 in potential profit. With this ratio, you can break even with just a 40% win rate, while a 3:1 ratio allows you to profit with only a 33% win rate.
Before entering a trade, ensure it meets at least a 2:1 reward-to-risk ratio. For instance, between October 25 and December 7 over a 25-year period, Allianz SE achieved a 76% win rate with average price moves of 6.57%. In such cases, even a slightly lower ratio like 1.5:1 might work, but aiming for 2:1 or higher adds a safety cushion.
Keep an eye on your profit factor, which is the total gross profit divided by total gross loss. A profit factor above 1.5 or ideally 2.0 signals an efficient strategy. If your profit factor dips below 1.5 over multiple cycles, it may be time to reevaluate your entry points, stop-loss levels, or the patterns you’re trading. Additionally, maintaining your maximum drawdown below 20% helps ensure that your account can endure losing streaks without jeopardizing future opportunities.
sbb-itb-e64548c
Top 5 Seasonality Trading Strategies | Algo Trading Strategy
Optimizing Seasonal Strategies with MillionMachine
MillionMachine takes your seasonal trading strategies to the next level by combining powerful backtesting capabilities with disciplined risk management and advanced optimization tools.
Visual Strategy Design and Testing
MillionMachine simplifies the process of creating seasonal strategies by eliminating the need for coding. Its intuitive drag-and-drop interface allows you to visually define entry and exit rules. For example, you can easily test strategies like "buy gold in September, sell in February" or "enter the S&P 500 on November 1 and exit on April 30", with the platform automatically running backtests for you.
To ensure realistic results, the platform uses a comprehensive historical dataset that spans multiple market cycles, capturing both bull and bear periods. This approach provides a clearer understanding of how your strategy might perform under varying economic conditions. Additionally, MillionMachine supports testing across diverse asset classes, enabling you to explore trends like EUR/USD movements in December, gold’s seasonal patterns, or the January Effect in equities.
The visual interface streamlines the entire process. Instead of writing complex code to test a seasonal hypothesis, you can set your parameters within minutes and immediately review performance over decades of data. This makes it much easier to compare seasonal windows side-by-side and pinpoint patterns that consistently hold up.
Parameter Optimization and Overfitting Tests
After building a seasonal strategy, MillionMachine’s optimization tools let you fine-tune parameters to improve performance. The platform uses techniques like walk-forward and out-of-sample testing to reduce the risk of overfitting. By dividing historical data into an in-sample training period (to find optimal seasonal windows), an out-of-sample validation period (to test those parameters on unseen data), and a live simulation, it ensures your strategy isn’t just tailored to past performance.
To further validate your strategy, MillionMachine incorporates permutation testing, also known as Monte Carlo analysis. This method randomizes historical daily returns to create thousands of simulated seasonal windows. Your strategy’s actual performance is then compared against this distribution, providing a P-value that quantifies its statistical edge.
Performance Analytics and Reporting
MillionMachine provides detailed analytics to evaluate your seasonal strategy’s performance. Key metrics like profit factor (with values above 2.0 indicating strong efficiency), Sharpe ratio, and Sortino ratio help measure risk-adjusted returns against a buy-and-hold benchmark. Yearly performance charts also highlight periods when your strategy was effective or when its seasonal pattern may have broken down. For example, a "Sell in May" strategy might thrive in one era but falter in another, signaling the need for adjustments.
The platform also separates out-of-sample validation results from in-sample data, offering a transparent view of how your strategy could perform in real-world scenarios. This clarity helps you focus on statistically reliable patterns rather than those overfitted to historical data, keeping your strategies grounded and effective.
Conclusion
Seasonal trading patterns offer a statistical advantage by leveraging predictable cycles influenced by factors like weather, consumer behavior, and institutional rebalancing. For example, major indices and commodities often exhibit clear seasonal trends across stocks, forex, and commodities markets. As noted by Equity Clock:
Seasonality analysis is a useful tool when looking at a general time to enter and exit equity markets and sectors. However, seasonality analysis is not precise.
To succeed, traders must combine seasonal timing with technical confirmation and thorough backtesting. It’s crucial to validate patterns using extensive historical data and conduct out-of-sample testing to avoid overfitting. Effective risk management, such as limiting exposure to 1–2% of your account per trade and ensuring a risk-reward ratio of at least 2:1, safeguards your capital when market conditions shift unexpectedly.
Tools like MillionMachine can help refine your approach by simplifying strategy design and offering features like permutation testing, performance analytics, and Monte Carlo simulations. These tools help identify genuine seasonal patterns while filtering out statistical anomalies. Detailed reporting ensures your strategies remain grounded in data, bridging the gap between analysis and execution.
It’s important to remember that seasonal patterns indicate probabilities, not certainties. Markets evolve, and unforeseen events can disrupt historical trends. By integrating seasonal insights with technical indicators, practicing disciplined risk management, and utilizing reliable backtesting tools, you can better position yourself to capture recurring opportunities while staying prepared for unexpected deviations.
MillionMachine.com is a platform designed for research, education, and strategy development. It does not provide personalized investment advice, trading guidance, or recommendations to buy or sell financial instruments. The platform is not a substitute for independent decision-making, and users are solely responsible for evaluating their trading choices and associated risks.
All simulations, backtests, and analytics generated by MillionMachine are hypothetical and not guarantees of future results. Hypothetical performance has inherent limitations and may differ significantly from real-world outcomes.
MillionMachine is not registered as a Commodity Trading Advisor (CTA), Investment Advisor, or Broker-Dealer with the NFA, CFTC, SEC, or any other regulatory body. While the founder was previously registered as a CTA with the National Futures Association (NFA), that registration is no longer active. MillionMachine does not engage in any regulated advisory activities.
The platform does not execute trades, manage customer funds, or provide access to live trading accounts. Any integration with broker APIs is strictly for user-initiated, user-controlled automation. Users are responsible for ensuring their trading activities comply with all applicable laws, regulations, and broker requirements.
All market data, charts, signals, and analytics displayed by MillionMachine are for informational and educational purposes only. MillionMachine does not verify the accuracy or completeness of market data and assumes no liability for errors, delays, or omissions.
Trading financial instruments, including futures, stocks, cryptocurrencies, and derivatives, involves substantial risk and may not be suitable for all investors. Losses can exceed your initial investment. Past performance, whether actual or simulated, is not indicative of future results.
FAQs
What are the key steps to reliably backtest seasonal trading strategies?
To effectively backtest seasonal trading strategies, start by collecting at least 10 years of historical data. This timeframe helps capture recurring patterns, such as calendar-based trends or economic cycles. Once you have the data, establish a specific and consistent rule for your strategy. For example, you might define entry and exit points based on certain dates or incorporate filters like volatility thresholds. Clear rules ensure your testing remains systematic and reliable.
Next, use a reliable backtesting platform to simulate your strategy across the dataset. Pay close attention to metrics like net profit, win rate, and maximum drawdown. To validate the reliability of your results, conduct out-of-sample tests and apply statistical checks to rule out the possibility that your strategy’s performance is due to random chance. Additionally, test the strategy across various asset classes to confirm that the seasonal effect isn’t confined to a single market.
By following these steps, you can separate genuine seasonal patterns from random fluctuations and refine your strategies for greater dependability.
MillionMachine.com is designed for research, education, and strategy development purposes only. It does not offer personalized investment, trading, or financial advice, nor does it solicit the buying or selling of financial instruments. MillionMachine does not provide recommendations or assess the suitability of any strategy, trade, or investment.
Users are fully responsible for evaluating their trading decisions and understanding the risks involved. All simulations, backtests, and performance metrics generated by MillionMachine are hypothetical and should not be considered guarantees of future outcomes. Hypothetical performance has inherent limitations and does not reflect actual trading results. Real-world outcomes may differ significantly.
MillionMachine is not registered as a Commodity Trading Advisor (CTA), Investment Advisor, or Broker-Dealer with the NFA, CFTC, SEC, or any other regulatory body. While the founder was previously registered as a CTA with the National Futures Association (NFA), that registration is no longer active, and MillionMachine does not engage in any regulated advisory activities.
MillionMachine does not execute trades, manage customer funds, or provide access to live trading accounts. Integration with broker APIs is solely for user-initiated and user-controlled automation. Users bear full responsibility for ensuring compliance with relevant laws, regulations, and broker requirements.
All market data, charts, signals, and analytics displayed by MillionMachine are intended for informational and educational purposes only. MillionMachine does not verify the accuracy or completeness of market data and assumes no responsibility for errors, delays, or omissions.
Trading financial instruments, including futures, stocks, cryptocurrencies, and derivatives, involves substantial risk and may not be suitable for all investors. It is possible to lose more than your initial investment. Past performance, whether actual or simulated, does not guarantee future results.
By using MillionMachine.com, you agree that you are solely responsible for your investment decisions. MillionMachine, its creators, and affiliates are not liable for any losses, damages, or trading outcomes resulting from the use of the platform.
What are the best ways to manage risk when trading seasonal patterns?
Managing risk in seasonal trading is a critical step to safeguard your capital and build long-term success. The first step? Backtest seasonal patterns over an extended historical period to verify their reliability. To ensure your findings aren’t overfitted, use techniques like out-of-sample testing or walk-forward analysis. Tools such as MillionMachine simplify this process, allowing you to test, validate, and fine-tune strategies – even without any coding expertise.
Once you’ve confirmed a pattern’s validity, implement risk management rules tailored to your strategy. For instance, cap individual trades at 1–2% of your total equity. Incorporate tools like ATR-based stop-losses to account for market volatility. To avoid putting all your eggs in one basket, diversify across various asset classes and seasonal timeframes, steering clear of excessive exposure to trades clustered in the same period. Keep an eye on your strategy’s performance and tweak parameters as market conditions shift. If a pattern results in a significant drawdown, like a 5% equity loss in one season, it may be time to pause or reassess its viability.
Seasonal patterns aren’t static – they can shift over time. Stay proactive by refining your methods regularly, keeping pace with market trends, and prioritizing strong risk management practices.
How can I distinguish real seasonal trading patterns from random market movements?
To spot genuine seasonal trading patterns, start by focusing on price movements that reliably repeat during the same time of year over several years. For instance, you might notice that a particular asset tends to perform better between November and April compared to other months. To confirm this, calculate the average return for the specific period and compare it to adjacent periods to identify any statistically significant differences.
Next, perform a backtest using at least 10–15 years of historical data. Use consistent entry and exit rules for each cycle and evaluate the outcomes. Tools like MillionMachine can assist in visualizing patterns, validating the logic of your strategy, and testing its reliability through methods like walk-forward analysis or Monte Carlo simulations. Only patterns that consistently perform well in out-of-sample tests should be treated as dependable.
Finally, cross-check the pattern with real-world influences, such as seasonal demand shifts or economic cycles. Don’t forget to factor in transaction costs and broader market conditions. A reliable seasonal pattern will demonstrate consistent results, statistical significance, and durability across varying market environments, distinguishing it from random market noise.
Important Disclosures About MillionMachine
MillionMachine.com is a platform designed for research, education, and strategy development. It does not provide personalized investment advice, trading recommendations, or financial guidance. Nothing on the website or within the platform should be interpreted as a solicitation to buy or sell any financial instruments.
Users are fully responsible for evaluating their own trading decisions and risks. All simulations, backtests, and performance metrics generated by MillionMachine are hypothetical and not guarantees of future outcomes. It’s important to note that hypothetical results come with inherent limitations and may differ significantly from actual trading results.
MillionMachine is not registered as a Commodity Trading Advisor (CTA), Investment Advisor, or Broker-Dealer with the NFA, CFTC, SEC, or any other regulatory body. While the founder was previously registered as a CTA with the National Futures Association (NFA), that registration is no longer active, and MillionMachine does not engage in any regulated advisory services.
The platform does not execute trades, manage customer funds, or provide access to real-time trading accounts. Any integrations with broker APIs are strictly for user-initiated and user-controlled automation. Users remain solely responsible for ensuring their trading activities comply with all applicable laws, regulations, and broker requirements.
All market data, charts, signals, and analytics provided by MillionMachine are solely for informational and educational purposes. The platform does not verify the accuracy or completeness of market data and assumes no liability for any errors, delays, or omissions.
Trading financial instruments – including futures, stocks, cryptocurrencies, and derivatives – carries inherent risks and may not be suitable for all investors. Losses can exceed your initial investment. Past performance, whether simulated or actual, does not guarantee future results.
By using MillionMachine.com, you acknowledge that you are solely responsible for your investment decisions and that MillionMachine, its creators, and affiliates are not liable for any losses, damages, or trading outcomes resulting from use of the platform.

