
Are your trading strategies actually profitable? Many traders focus on net profit, but that’s only part of the picture. To truly assess performance, you need to dive deeper into metrics like profit factor, win-loss ratios, and risk-adjusted returns.
Here’s what you need to know:
- Profit Factor: Measures gross profit vs. gross loss. A value above 1.5 is promising; below 1.0 signals losses.
- Win Rate: High win rates don’t guarantee success if average losses exceed average wins.
- Risk-Reward Ratio: A 2:1 or higher ratio can offset lower win rates.
- Risk Metrics: Tools like Sharpe ratio and maximum drawdown evaluate strategy stability and risk exposure.
- Execution Challenges: Slippage, latency, and transaction costs can erode profits, so always account for these in backtests.
A balanced trading strategy isn’t just about making money – it’s about understanding the risks, maintaining consistency, and ensuring your methods hold up in live markets. Platforms like MillionMachine can help automate these evaluations, but the key is knowing which metrics to prioritize and how to interpret them.
Let’s break this down further.
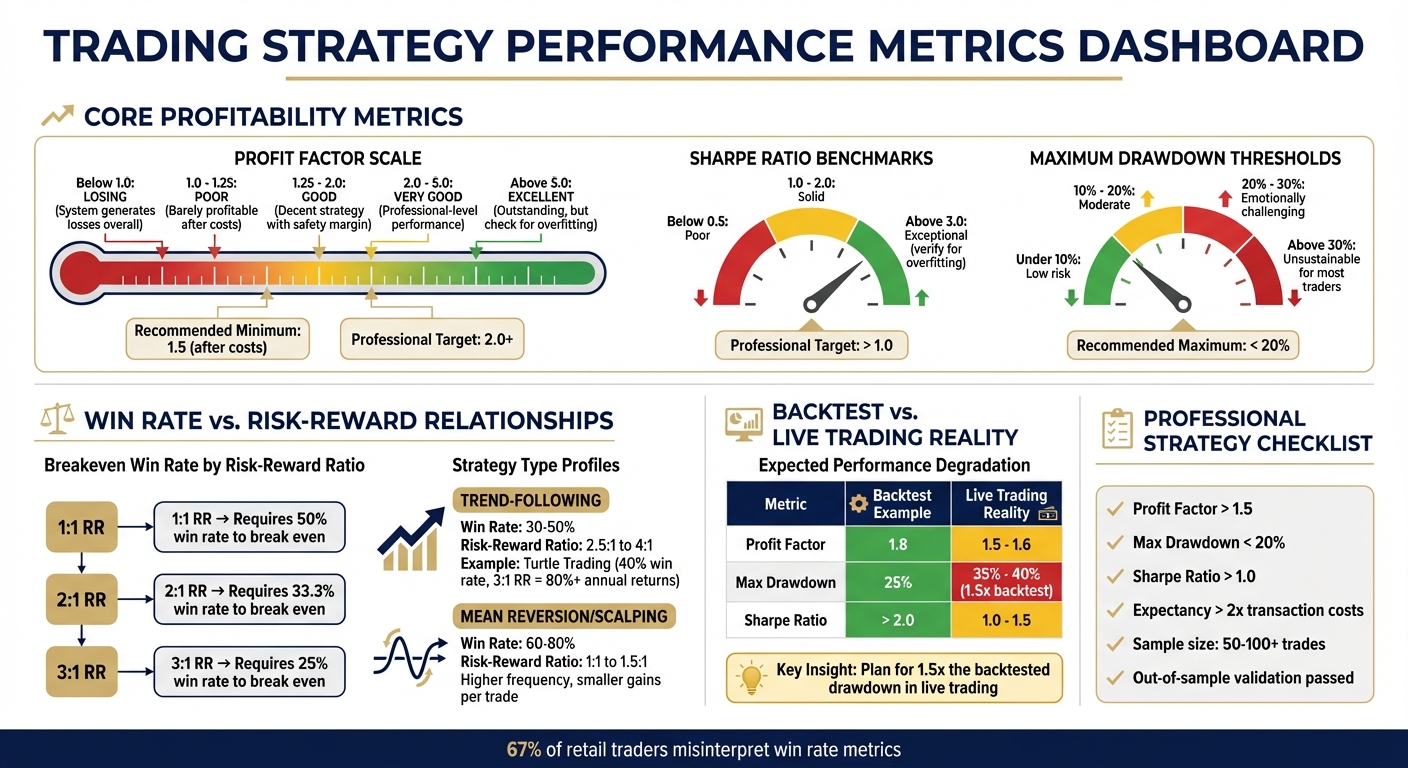
Trading Strategy Performance Metrics: Benchmarks and Interpretation Guide
What Makes a Really Good TradingView Strategy? Max Drawdown, Profit Factor, Win Rate, …

Core Profitability Metrics
When evaluating a trading strategy, the central question is simple: does it make money? The answer depends on whether you’re looking at gross profitability or net profitability. Knowing the difference between these two metrics is essential for a deeper dive into how risk impacts overall performance.
Gross vs. Net Profitability
Gross profit represents the total gains from all winning trades before any deductions. It’s essentially the best-case scenario for earnings. On the flip side, gross loss accounts for the total losses from losing trades.
Net profitability, however, tells a more complete story. It’s what’s left after subtracting gross losses and trading costs, such as brokerage fees, taxes, and slippage. A strategy might look great on paper with impressive gross profits, but once these real-world costs are factored in, the returns can shrink dramatically.
Take high-frequency strategies, for example. These often see their gross profits eroded by the sheer volume of trading costs. To gauge a strategy’s viability, traders often use the profit factor, which is calculated by dividing gross profit by gross loss. A profit factor above 1.5 suggests a promising strategy, while anything below 1.0 signals a losing system. Numbers close to 1.0 leave little room to cover real-world expenses.
Here’s a key insight: even a strategy with a 70% win rate can fail if the average loss outweighs the average win. On the other hand, professional trend-following strategies often succeed with win rates as low as 30–40% because their winning trades far exceed their losses. As BacktestBase puts it:
A 70% win rate can be excellent or terrible depending on profit factor. If your average win is smaller than your average loss, even 70% win rate will lose money.
To ensure your strategy holds up in live trading, include realistic costs when backtesting on platforms like MillionMachine. For instance, a backtest showing a profit factor of 1.8 might drop to 1.5–1.6 in real-world conditions due to execution costs. A profit factor of at least 1.5 is necessary to account for these expenses.
While these raw numbers are critical, they don’t tell the whole story. To truly understand a strategy’s performance, you need to factor in risk.
Risk-Adjusted Profitability
Profit alone doesn’t paint a complete picture – it’s crucial to consider the risks taken to achieve those profits. Imagine two strategies, both generating $50,000 in net profit. If one endures a 5% drawdown while the other suffers a 45% drawdown, they’re not equally appealing. A severe drawdown not only tests your financial resilience but also your ability to stick with the strategy during tough times.
This is where risk-adjusted metrics come into play. Tools like the Sharpe ratio (which measures returns relative to volatility) and maximum drawdown (the steepest decline in your account’s value) help you assess whether your profits come from skill or excessive risk-taking. A high-profit system with large drawdowns is far less attractive than one that delivers steady, smaller gains without extreme volatility.
As Investopedia puts it:
Total net profit should be viewed in concert with other performance metrics… by itself, this metric cannot determine if a trading system is performing efficiently.
Another valuable metric is the recovery factor, calculated by dividing net profit by maximum drawdown. This shows how well a strategy recovers from losses. A recovery factor above 2.0 is generally acceptable, while anything over 5.0 is exceptional. These risk-adjusted measures ensure you’re not just chasing profits but building a strategy resilient enough to handle inevitable losing streaks.
Win-Loss Ratios in Strategy Evaluation
Win Rate: Definition and Common Mistakes
Win rate measures the percentage of trades that end in profit. For example, if you make 100 trades and 60 are winners, your win rate is 60%. Simple, right? But here’s the catch: many traders mistakenly believe a high win rate automatically means a profitable strategy. That’s not always true. Even an impressive 80% win rate can lead to losses if the remaining 20% of trades result in much larger losses than the wins. As UserIntuition explains:
"A trading system with an 80% win rate might actually lose money if the losses are significantly larger than the wins."
Research shows that 67% of retail traders misinterpret win rate metrics. Although the average retail forex trader achieves a win rate of 50% to 55%, about 70% still end up losing money because their losses outpace their gains. This misunderstanding often leads traders to tweak their systems in pursuit of higher win rates, potentially disrupting the balance between gains and losses.
So, what’s the takeaway? Win rate alone doesn’t tell the full story. To properly evaluate a trading strategy, you need to look beyond how often you win and consider the size of your wins compared to your losses.
This brings us to the importance of understanding the relationship between average gains and losses.
Average Win vs. Average Loss
The real key to profitability lies in the balance between your average win size and average loss size, often expressed as the risk-reward ratio (or win-loss ratio). This ratio is calculated by dividing your average win by your average loss. For example:
- With a 2:1 risk-reward ratio, you only need a 33.3% win rate to break even.
- A 3:1 ratio lowers that requirement to 25%.
- A 1:1 ratio, however, requires a 50% win rate to avoid losses.
Let’s look at two real-world examples. Warren Buffett, from 1980 to 2020, had a win rate of about 52%. That’s just slightly better than flipping a coin. However, his average gain on winning investments was over six times larger than his average loss, resulting in exceptional long-term returns. Similarly, participants in the famous Turtle Trading Experiment had win rates below 40%. But thanks to risk-reward ratios exceeding 3:1, they achieved annual returns of more than 80%.
To evaluate the effectiveness of any trading strategy, you can use this formula for expectancy:
(Win Rate × Average Win) – (Loss Rate × Average Loss).
Different trading styles call for different balances. For example:
- Scalping and mean-reversion strategies often rely on high win rates (60–75%) but lower risk-reward ratios (around 1:1 to 1.5:1).
- Trend-following strategies, on the other hand, can thrive with lower win rates (35–45%) as long as they maintain higher risk-reward ratios (2.5:1 to 4:1).
When testing your strategy on platforms like MillionMachine, don’t forget to factor in transaction costs. Commissions and slippage can eat into your profits, reducing average wins and increasing losses by as much as 8–12%.
Advanced Profitability Metrics
Building on basic profitability and win-loss evaluations, advanced metrics provide a deeper dive into understanding trading performance.
Profit Factor
Profit factor is a key metric that compares your total gross profit to your total gross loss. Unlike win rate, which only shows how often your trades succeed, profit factor measures the overall effectiveness – or edge – of your trading strategy.
Here’s how it works: a profit factor above 1.0 means your system is profitable, while anything below 1.0 indicates a losing strategy. Experts often recommend avoiding systems with a profit factor under 1.5, especially after factoring in slippage and commissions. Systems with profit factors between 1.25 and 1.75 have narrower safety margins, while professional-grade strategies typically fall between 2.0 and 5.0.
Be cautious with profit factors exceeding 5.0, as they may suggest overfitting, which could make the strategy unreliable in real-world trading.
| Profit Factor Range | Performance Rating | What It Means |
|---|---|---|
| Below 1.0 | Losing | The system generates losses overall |
| 1.0 – 1.25 | Poor | Barely profitable after costs |
| 1.25 – 2.0 | Good | Decent strategy with some safety margin |
| 2.0 – 5.0 | Very Good | Professional-level performance |
| Above 5.0 | Excellent | Outstanding, but check for overfitting |
To enhance your profit factor, you might focus on cutting your losses more quickly or holding onto winning trades longer. Just make sure you validate this metric over a sample size of at least 50–100 trades to avoid skewed results from too few data points.
Sharpe Ratio
The Sharpe Ratio is all about risk-adjusted returns. It tells you how much excess return your strategy generates for each unit of volatility. To calculate it, you subtract the risk-free rate from your average return, then divide by the standard deviation of returns.
For example, a strategy with 15% annual returns and 5% volatility has a Sharpe Ratio of 3.0, which is statistically stronger than one delivering 20% returns but with 15% volatility, resulting in a Sharpe Ratio of about 1.33.
Here’s a general guideline:
- A Sharpe Ratio below 0.5 is considered poor.
- Ratios between 1.0 and 2.0 are solid.
- Anything above 3.0 warrants a closer look to ensure the strategy isn’t overfitted.
Keep in mind, the Sharpe Ratio isn’t the whole picture. High volatility can make a system impractical, so always pair it with other metrics. And remember, live trading results can differ due to factors like slippage, so build in safety margins.
Maximum Drawdown
Maximum drawdown measures the largest drop in your account equity from a peak to a trough during a given period. It’s calculated by subtracting the trough value from the peak, dividing by the peak, and converting the result into a percentage. This metric highlights the worst-case scenario your strategy might face.
Why is it important? Because while you might think you can handle a 30% drawdown, many traders panic when losses hit even 15%. Here’s a quick breakdown:
- Drawdowns under 10% are low risk.
- Between 10% and 20% are moderate.
- From 20% to 30% can be emotionally challenging.
- Anything above 30% is often unsustainable for most traders.
A good rule of thumb: only trade strategies where you can emotionally handle 1.5 times the backtested maximum drawdown. That’s because real-world trading often sees larger drawdowns than the backtests suggest. For instance, a system that generates $50,000 in profit with a 5% drawdown is far more reliable than another system with the same profit but a 45% drawdown.
Up next, we’ll dive into how execution factors like slippage and latency can further complicate these theoretical metrics.
sbb-itb-e64548c
Execution and Performance Gaps
Even the most promising backtested strategy can face serious hurdles when it transitions to live trading. The gap between what your backtest predicts and what actually happens in your brokerage account often boils down to two key factors: slippage and latency.
Slippage and Latency
Backtests rely on precise historical prices, but live trading is a different ballgame. Slippage occurs when the price at which your order is executed differs from the expected price. Latency, on the other hand, refers to the delay between receiving a trading signal and executing the order. These issues can be especially problematic during periods of high market volatility or when trading less liquid assets. For instance, even a split-second delay can result in missing your target price, and for high-frequency strategies, this can completely erode any competitive edge.
To account for these challenges, many experts recommend aiming for a backtested profit factor of at least 1.5. Anything lower is likely to turn unprofitable once you factor in execution costs like slippage and latency.
To reduce the impact of these issues, consider testing your strategy in a simulated environment for one to three months before risking actual capital. Additionally, avoid strategies where your average trade profit is less than double your commission costs – this is often a sign that slippage could undermine your profitability.
While addressing slippage and latency is crucial, live trading introduces other performance shifts that can further widen the gap between backtested and live results.
Backtesting vs. Live Trading Results
The differences between backtesting and live trading go beyond technical execution. Backtesting provides a controlled, idealized view of how a strategy might have performed, but live trading introduces psychological stress and unpredictable market behavior.
For example, you should expect your maximum drawdown in live trading to be about 1.5 times larger than what your backtest indicates. If your backtest shows a 25% drawdown, you might face 35% to 40% in real trading conditions. Similarly, backtested Sharpe ratios above 2.0 often drop to somewhere between 1.0 and 1.5 when applied to live trading.
Here’s a comparison of key metrics between backtested and live trading expectations:
| Metric | Backtest Example | Realistic Live Expectation |
|---|---|---|
| Profit Factor | 1.8 | 1.5 – 1.6 |
| Max Drawdown | 25% | 35% – 40% |
| Sharpe Ratio | > 2.0 | 1.0 – 1.5 |
One major issue that often goes unnoticed is overfitting. When a strategy is overly optimized for historical data, it may end up capturing noise instead of meaningful market signals. This can result in impressive backtest metrics that fail miserably in live trading. A practical way to combat overfitting is through out-of-sample testing – reserve the last 20% of your historical data and only test on it after completing your optimizations. This approach provides a more realistic assessment of your strategy’s robustness.
Transaction costs also play a significant role in the gap between backtested and live results. Commissions, exchange fees, and bid-ask spreads can quickly eat into your profits, especially for day traders executing multiple trades daily. Make sure your backtests include realistic cost estimates, and aim for an average profit per trade that’s at least two to three times higher than these costs.
Finally, the psychological challenges of live trading can’t be ignored. Many traders find that the drawdowns they thought they could handle on paper feel much more intense when real money is on the line. To prepare for this, only trade strategies where you’re genuinely comfortable with drawdowns up to 1.5 times the backtested maximum. The emotional toll of live trading can be just as significant as the technical challenges, so it’s essential to approach it with realistic expectations and thorough preparation.
Combining Metrics for Strategy Evaluation
Metric Relationships and Trade-Offs
No single metric can fully capture the effectiveness of a trading strategy. Take win rate, for example – an 80% win rate might seem impressive, but if your average loss is five times larger than your average win, it’s a recipe for disaster. That’s where expectancy comes in, combining win rate, average win, and average loss into a single, per-trade estimate.
Win rate and risk-reward (RR) ratios are closely connected. The breakeven point changes significantly based on your RR ratio: with a 1:1 RR, you need a 50% win rate to break even, but with a 3:1 RR, you only need a 25% win rate.
"Win rate means nothing without profit factor and RR." – HorizonAI
Different strategies naturally produce distinct metric profiles. For instance, trend-following systems often have low win rates (30-50%) but boast high risk-reward ratios above 3:1. On the other hand, mean reversion strategies tend to have higher win rates (60-80%) but operate with lower risk-reward ratios. A classic example of this is the Turtle Trading experiment from 1983-1984, where a trend-following approach with a win rate below 40% achieved average annual returns exceeding 80%, thanks to maintaining win-loss ratios above 3:1.
Before committing real money, it’s wise to use a checklist to evaluate your strategy. A good starting point might include these benchmarks: Profit Factor > 1.5, Max Drawdown < 20%, Sharpe Ratio > 1.0, and Expectancy > 2x transaction costs. Research reveals that 67% of retail traders misunderstand the relationship between win rate and win-loss ratios, leading to flawed evaluations of their strategies.
By combining these metrics, you lay the foundation for using advanced tools that simplify strategy evaluation.
Using Tools for Analysis
Analyzing these metrics manually across dozens – or even hundreds – of trades can be time-consuming and prone to errors. That’s where automated tools come in. MillionMachine (https://millionmachine.com) is one such platform that streamlines the process. It allows users to visually design trading strategies, optimize parameters, and analyze performance across various asset classes – all without needing to write a single line of code. The platform automatically calculates crucial metrics like profit factor, Sharpe ratio, and maximum drawdown, presenting the results in polished, professional-grade reports.
MillionMachine also enhances strategy development by automating the testing and validation of metric combinations. For example, if you’re aiming for a minimum profit factor of 2.0 or prefer a 3:1 RR, the platform can generate and test strategies that meet those criteria. It even includes Monte Carlo simulations to check for overfitting, shuffling trade sequences to ensure your strategy’s success wasn’t just a fluke.
For a strategy to hold up statistically, backtests should include at least 50-100 trades. MillionMachine takes care of this by flagging any sample sizes that are too small and providing confidence levels for your metrics. This helps traders avoid the common mistake of relying on strategies that look promising on paper but are based on insufficient data. By turning raw performance data into actionable insights, these tools ensure you’re building strategies with a solid statistical foundation instead of relying on guesswork.
Conclusion
Grasping the concepts of profitability and win-loss ratios is essential for understanding the true strengths and weaknesses of your trading strategy. Looking at net profit alone won’t reveal the risks you took, the consistency of your returns, or whether you can emotionally endure the inevitable drawdowns. A high win rate might seem impressive, but one large loss can easily erase the gains from numerous smaller wins.
To evaluate strategies effectively, professional traders rely on a mix of metrics rather than focusing on just one. Generally, they aim for a Profit Factor above 2.0, a Sharpe Ratio over 1.0, and drawdowns under 20%. Before committing real capital, it’s critical to stress-test your strategy with at least 50–100 trades and validate it using out-of-sample data. This helps identify overfitting issues that could derail your strategy in live markets. Keep in mind that live metrics often fall short of backtest results – if your backtest shows a Profit Factor of 1.8, real-world performance might land closer to 1.5 due to slippage and execution challenges. Tools that automate these evaluations can save time and improve accuracy.
Platforms like MillionMachine (https://millionmachine.com) simplify this process by instantly calculating crucial metrics and running Monte Carlo simulations. By turning raw trade data into meaningful insights, these tools allow traders to base their strategies on solid statistical evidence rather than intuition or incomplete data.
MillionMachine.com is designed for research, education, and strategy development purposes only. Nothing provided on the website or within the platform should be interpreted as personalized investment, trading, or financial advice, nor as a solicitation to buy or sell any financial instrument. MillionMachine does not offer recommendations or guidance on the suitability of any strategy, trade, or investment.
Users are solely responsible for assessing their own trading decisions and risks. All simulations, backtests, performance metrics, and analytics generated by MillionMachine are hypothetical and do not guarantee future results. Hypothetical performance comes with inherent limitations and does not reflect actual trading outcomes. Real-world results may vary significantly from simulated data.
MillionMachine is not registered as a Commodity Trading Advisor (CTA), Investment Advisor, or Broker-Dealer with the NFA, CFTC, SEC, or any regulatory body. While the founder was previously registered as a CTA with the National Futures Association (NFA), that registration is no longer active, and MillionMachine does not engage in regulated advisory services.
The platform does not execute trades, manage customer funds, or provide access to live trading accounts. Any broker API integrations are solely for user-initiated, user-controlled automation. Users are fully responsible for ensuring their trading activities comply with all applicable laws, regulations, and broker requirements.
All market data, charts, signals, and analytics displayed by MillionMachine are for informational and educational purposes only. MillionMachine does not guarantee the accuracy or completeness of market data and is not liable for errors, delays, or omissions.
Trading in financial instruments – including futures, stocks, cryptocurrencies, and derivatives – carries substantial risk and may not be suitable for all investors. Losses can exceed your initial investment. Past performance, whether actual or simulated, is not a reliable indicator of future results.
FAQs
What is profit factor in trading, and how can I improve it?
Profit factor is an essential metric in trading, offering a clear ratio of total gross profit to total gross loss. A profit factor above 1.0 signals a profitable strategy, and a value of 1.5 or higher is typically considered strong. Unlike win rate, this metric also considers the size of both winning and losing trades, giving a fuller picture of performance.
If you’re looking to improve your profit factor, here are some practical steps to consider:
- Boost your average profit per trade by refining your entry points or targeting larger price movements.
- Cut losses quickly by using disciplined stop-loss orders or exiting losing trades at predefined levels.
- Improve your risk-reward ratio by aiming for returns that are at least 2–3 times the risk on each trade.
- Avoid overtrading, which can lead to unnecessary transaction costs and dilute your trading edge.
To measure and refine these adjustments, backtesting is crucial. Tools like MillionMachine let you design and test strategies visually, optimize parameters, and analyze performance – all without requiring coding expertise. This data-driven approach can help you make informed tweaks to enhance profitability.
MillionMachine.com is a platform designed for research, education, and strategy development. It does not provide personalized investment advice, trading recommendations, or financial guidance of any kind.
Users are fully responsible for evaluating their own trading decisions and risks. All simulations, backtests, and performance metrics generated by MillionMachine are hypothetical and do not guarantee future results. Actual trading outcomes may differ significantly from simulated scenarios.
MillionMachine is not registered as a Commodity Trading Advisor (CTA), Investment Advisor, or Broker-Dealer with the NFA, CFTC, SEC, or any other regulatory body. While the founder was previously registered as a CTA with the National Futures Association (NFA), that registration is no longer active, and MillionMachine does not engage in any regulated advisory activities.
The platform does not execute trades, manage customer funds, or provide access to live trading accounts. Any integration with broker APIs is for user-initiated, user-controlled automation only. Users are responsible for ensuring compliance with all applicable laws, regulations, and broker requirements.
All market data, charts, signals, and analytics provided by MillionMachine are for informational and educational purposes only. The platform does not verify the accuracy or completeness of market data and assumes no responsibility for errors, delays, or omissions.
Trading financial instruments – such as futures, stocks, cryptocurrencies, and derivatives – carries substantial risk and may not be suitable for all investors. Losses can exceed your initial investment. Past performance, whether simulated or actual, is not indicative of future results.
By using MillionMachine.com, you agree that you are solely responsible for your investment decisions and that MillionMachine, its creators, and affiliates are not liable for any losses, damages, or trading outcomes resulting from your use of the platform.
Why are risk-adjusted returns important when evaluating a trading strategy?
Risk-adjusted returns matter because they show how much profit a strategy generates compared to the risk involved. A strategy might look attractive due to high returns, but if it comes with large drawdowns or high volatility, it could threaten long-term success. Metrics like the Sharpe ratio evaluate returns against volatility, while the profit factor measures how much is earned for every dollar of risk by comparing total gains to total losses.
With tools like MillionMachine, traders can backtest strategies and automatically calculate key risk-adjusted metrics such as the Sharpe ratio, profit factor, and maximum drawdown. These insights enable traders to identify strategies that aim for consistent returns while keeping risks in check.
MillionMachine.com is designed for research, education, and strategy development purposes only. Nothing on the website or within the MillionMachine platform should be considered personalized investment, trading, or financial advice. It also does not serve as a solicitation to buy or sell any financial instruments. MillionMachine does not provide recommendations or guidance on the suitability of any strategy, trade, or investment.
Users are fully responsible for their own trading decisions and associated risks. All simulations, backtests, and performance metrics produced by MillionMachine are hypothetical and not guarantees of future performance. Hypothetical results have inherent limitations and do not reflect actual trading outcomes. Real-world results may vary significantly from simulated data.
MillionMachine is not registered as a Commodity Trading Advisor (CTA), Investment Advisor, or Broker-Dealer with the NFA, CFTC, SEC, or any other regulatory body. While the founder was previously registered as a CTA with the National Futures Association (NFA), that registration is no longer active. MillionMachine does not engage in any regulated advisory services.
The platform does not execute trades, manage customer funds, or provide access to live trading accounts. Any integration with broker APIs is strictly for user-initiated and user-controlled automation. Users are entirely responsible for ensuring compliance with all applicable laws, regulations, and broker requirements.
Market data, charts, signals, and analytics provided by MillionMachine are intended for informational and educational use only. MillionMachine does not verify the accuracy or completeness of market data and accepts no responsibility for any errors, delays, or omissions.
Trading financial instruments, including futures, stocks, cryptocurrencies, and derivatives, involves substantial risk and may not suit all investors. Losses can exceed your initial investment. Past performance, whether actual or simulated, is not an indicator of future results.
By using MillionMachine.com, you acknowledge and agree that you are solely responsible for your investment decisions. MillionMachine, its creators, and affiliates are not liable for any losses, damages, or trading outcomes resulting from the use of the platform.
Why doesn’t a high win rate always lead to a profitable trading strategy?
A high win rate might seem like the golden ticket to success, but it doesn’t automatically mean you’re making money. Here’s why: it doesn’t factor in the size of your wins compared to your losses. Imagine a strategy that racks up lots of small wins but occasionally takes a massive loss – this could still leave you in the red overall.
Profitability hinges on several key elements, such as the risk-reward ratio, trade size, and profit factor. Even if you’re winning most of the time, if your losses are much larger than your gains on average, the strategy could still fail to deliver profits. That’s why it’s crucial to strike a balance between win rate and these other important metrics to achieve sustainable success.


Elena R. on June 7, 2026
Great point on recovery factor—that 5.0 threshold separates noise from real edge. I spent years chasing generic bots that couldn’t handle gold’s geopolitical sensitivity, then realized my drawdown recovery was tanking because I wasn’t matching the EA to market regime. After switching to specialized tools like the gold-focused bots in Ratio X Toolbox (www.ratioxtrade.com), my recovery factor jumped above 4.0 in backtesting. The key insight: one EA doesn’t work across all conditions, so having the right instrument for each setup actually reduced my max drawdown while keeping the upside intact. Are you running separate strategies for different market structures, or forcing one bot to do everything?