
Monte Carlo simulations are a powerful tool to analyze trading strategies by simulating thousands of potential outcomes based on historical trade data. Unlike traditional backtests, which show only one possible result, these simulations test the variability of results by reshuffling or resampling trade sequences. The goal? To identify risks like sequence risk and worst-case drawdowns that could derail your strategy.
Key takeaways:
- Monte Carlo simulations reveal risks not visible in backtests, such as drawdowns up to 3.1x larger.
- Resampling (with replacement) creates broader variability by repeating or omitting trades.
- Reshuffling (without replacement) keeps all trades but rearranges their order to test sequence risk.
- Using 95% confidence levels, traders can estimate capital needs and avoid underestimating risks.
- Metrics like Risk of Ruin, 95% Max Drawdown, and 5th Percentile Profit help assess strategy reliability.
To integrate these insights, platforms like MillionMachine simplify running simulations, offering tools to test strategies across various market conditions and asset classes. By using data-driven results, traders can better prepare for market volatility and make informed decisions.
Monte Carlo Simulation for Trading | Why Backtest Isn’t Enough?
sbb-itb-e64548c
Resampling and Reshuffling Methods Explained
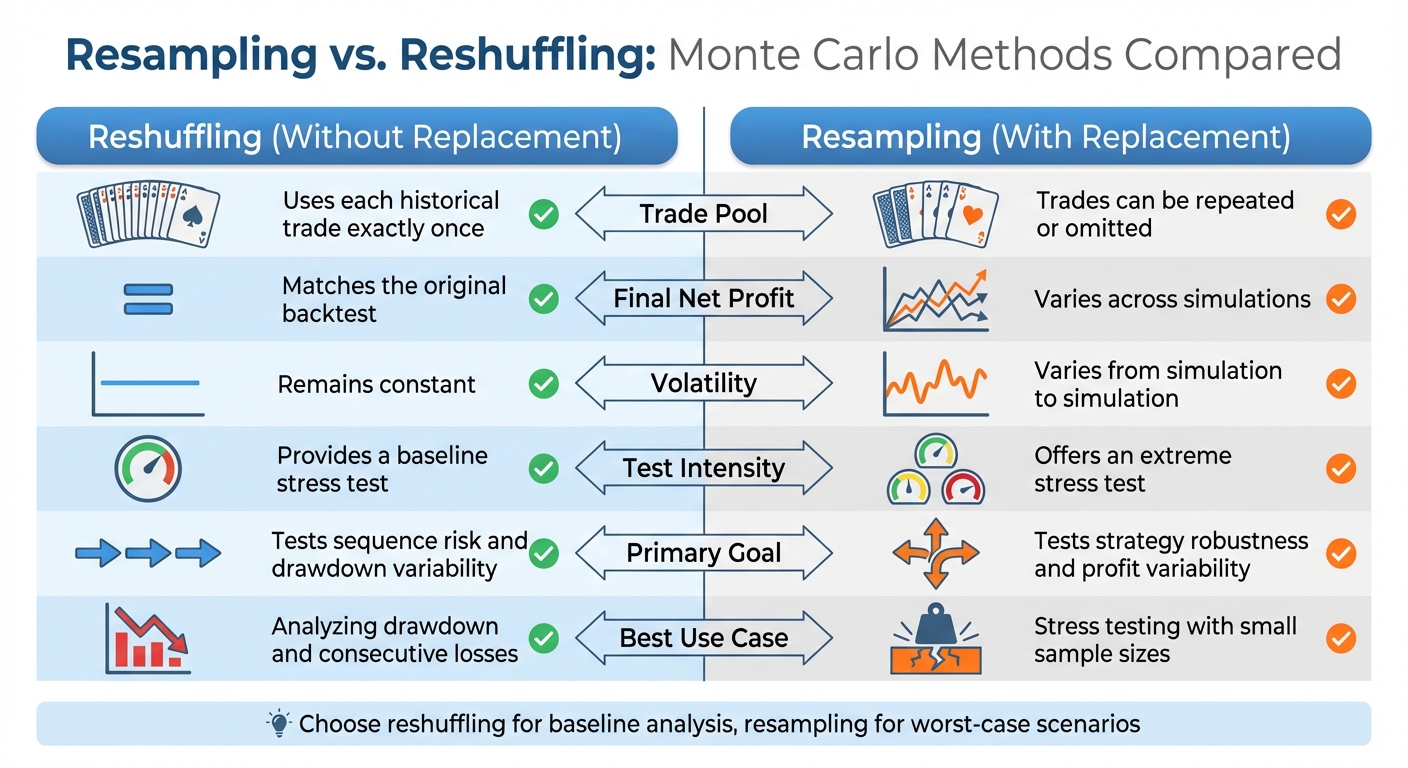
Monte Carlo Resampling vs Reshuffling Methods Comparison
What Is Resampling?
Resampling, often called sampling with replacement, is a technique used to test the variability of trade sequences in Monte Carlo analysis. It involves randomly selecting trades from your historical backtest to create new equity curves. In this process, a single trade might appear multiple times in a simulation, while others may not show up at all. This randomness generates a broader range of outcomes, with each simulation producing different levels of total profits, volatility, and drawdowns.
Imagine drawing cards from a deck, where each card is returned to the deck before the next draw. You might draw the same card more than once or miss some cards entirely. This method helps evaluate how your strategy might perform if future trade distributions resemble but don’t exactly match historical results.
"Resampling with replacement means not all simulations end at the same amount… it creates much more variety in simulated strategy returns." – Daniela Hanicova, Quant Analyst, Quantpedia
What Is Reshuffling?
Reshuffling, also known as sampling without replacement, rearranges the sequence of your trades without changing their occurrence. Every trade from your historical backtest is included exactly once, but in a different order. While the total net profit remains the same as the original backtest, the order of trades can significantly influence the path of drawdowns.
Think of it as shuffling a deck of cards – you still have all the same cards, just in a different sequence. This method is particularly useful for examining sequence risk, which refers to the potential clustering of losing trades that could lead to deeper drawdowns than initially observed.
"By simply reshuffling the trades your final profit will stay the same, but your drawdown can change a lot." – Mark Fric, StrategyQuant
Resampling vs. Reshuffling Comparison
| Feature | Reshuffling (Without Replacement) | Resampling (With Replacement) |
|---|---|---|
| Trade Pool | Uses each historical trade exactly once | Trades can be repeated or omitted |
| Final Net Profit | Matches the original backtest | Varies across simulations |
| Volatility | Remains constant | Varies from simulation to simulation |
| Test Intensity | Provides a baseline stress test | Offers an extreme stress test |
| Primary Goal | Tests sequence risk and drawdown variability | Tests strategy robustness and profit variability |
| Best Use Case | Analyzing drawdown and consecutive losses | Stress testing with small sample sizes |
This comparison highlights when to use each method based on your focus. Reshuffling is ideal as a starting point to determine if your drawdown was influenced by a favorable trade sequence. Resampling, on the other hand, is better suited for assessing how much capital you might need to withstand worst-case scenarios, as its 95th percentile results provide insight into potential capital requirements.
How to Run Monte Carlo Simulations
Setting Up the Simulation
Start by gathering reliable historical trade data. This includes key metrics like net profit/loss, trade sequence, and maximum drawdown from a completed backtest. The quality of this data directly impacts the accuracy of your simulations.
Next, define the parameters for your simulation. Begin with your initial account balance, which should match the capital you plan to use in real-world trading. Decide on the number of iterations to run – while 100 simulations can provide basic insights, 1,000 or more simulations are ideal to take full advantage of the law of large numbers. Don’t forget to factor in trading costs, such as commissions and slippage, to ensure your simulations reflect real-world conditions.
You’ll also need to choose a simulation method. Reshuffling without replacement keeps the overall profit constant and tests sequence risk, while resampling with replacement introduces more variability to stress-test your strategy’s performance under different conditions. For added realism, consider applying a trade skip rate of 5% to 10% to simulate real-world issues like internet disruptions or platform errors. Once your parameters are set, you’re ready to run the simulations.
Running Simulations
With everything in place, execute the simulation to generate hundreds or even thousands of equity curves. The simulation software will repeatedly process your trade data, creating alternative equity paths that reflect different possible outcomes. These simulations capture metrics like maximum drawdown, final net profit, and equity trajectories. By the end, you’ll have a dataset that illustrates the range of outcomes your trading strategy might produce under varying conditions.
After running the simulations, the next step is to evaluate the results and assess your strategy’s robustness.
Interpreting Results
When analyzing your simulation results, focus on the 95% confidence level, which accounts for scenarios where there’s only a 5% chance of performance falling below the calculated metric. For instance, if your backtest shows a drawdown of $1,663.90 but the Monte Carlo simulation at the 95% confidence level reveals a drawdown of $5,195.17 – over three times larger – it’s a clear warning sign. This indicates that the strategy may have relied more on luck than a genuine edge.
"If drawdown at 95% level is double or even more than drawdown of original strategy then trading this EA would be dangerous. It means that it achieved small drawdown in your test mostly by luck." – Mark Fric, StrategyQuant
Pay close attention to the visual "straw broom" chart of equity curves. If the curves are tightly clustered, it suggests your strategy is consistent. However, widely dispersed curves indicate a high sensitivity to trade sequence and market noise. To prepare for worst-case scenarios, use the 95% confidence drawdown value – not the backtest drawdown – to determine the minimum capital required. This approach helps protect your account from ruin when your strategy encounters tougher market conditions than those seen in your backtest. It directly addresses the sequence risk and drawdown concerns highlighted earlier.
Key Metrics from Monte Carlo Simulations
Critical Metrics to Evaluate
Monte Carlo simulations provide a deeper look into your strategy’s risk and performance. One of the most important metrics, Risk of Ruin, calculates the likelihood of your account hitting zero or a pre-set stop point. This figure is crucial for understanding whether your position sizing is too aggressive for the strategy’s win rate.
Another key metric is the Maximum Drawdown at the 95% confidence level, which predicts the largest equity dip you might face with 95% certainty. This value often exceeds the drawdown seen in backtests. Then there’s the 5th percentile profit, a measure of the worst-case scenario where only 5% of simulations perform worse. If this number is negative, it highlights a lack of edge in your strategy. The median final balance, or the 50th percentile, offers a realistic benchmark for your strategy’s expected performance.
Time to Target is another valuable metric, estimating how long it might take to reach your financial goals while considering volatility and trade frequency. Additionally, some platforms use a Robustness Score – a composite grade (e.g., A+ to F) – to summarize strategy stability by analyzing drawdown and profit-to-drawdown ratios across multiple percentiles. Together, these metrics create a solid foundation for assessing the reliability and durability of your trading approach.
Using Metrics to Test Strategy Reliability
These metrics aren’t just numbers – they’re tools to evaluate and refine your strategy. For example, comparing the backtest drawdown with the 95% simulation drawdown can reveal overfitting. If the simulated drawdown is significantly higher, your strategy might be relying more on luck than on a genuine edge.
A practical example: a system with a 40% win rate and 2R returns used Full Kelly position sizing, which resulted in a 19% chance of account blowout. However, switching to Half-Kelly cut the Risk of Ruin dramatically while still allowing 76% of simulations to hit a $1 million target within 10 years. This shows how adjusting position sizing can balance risk and reward effectively.
"You don’t win by being right all the time. You win by staying in the game long enough to let your edge work." – Kamil, Markets & Manners
Another critical metric is the Return/Drawdown Ratio at the 95% confidence level. This measures whether the potential rewards justify the risks when randomness is stripped away. If this ratio drops by more than 50% compared to your backtest, it’s a red flag that your strategy might not hold up under real conditions. By leveraging these insights, you can fine-tune your strategy’s position sizing and risk parameters for better reliability.
Monte Carlo Metrics Reference Table
| Metric | What it Measures | How it Evaluates Reliability |
|---|---|---|
| Risk of Ruin | Probability of account balance hitting zero or a stop limit. | Highlights if position sizing is too risky for the strategy’s win rate. |
| 95% Max Drawdown | Deepest equity dip expected with 95% certainty. | Shows whether historical drawdowns were realistic or just a lucky sequence. |
| 5th Percentile Profit | Worst-case profit scenario (5% of runs perform worse). | If negative, indicates the strategy lacks a reliable edge. |
| Median Final Balance | Most likely outcome (50th percentile). | Sets realistic performance expectations versus idealized backtests. |
| Time to Target | Time needed to reach specific financial goals. | Helps set realistic goals and manage expectations during slow periods. |
| Robustness Score | Composite grade based on multiple simulation factors. | Provides a quick comparison of strategy stability across different scenarios. |
MillionMachine Monte Carlo Tools

MillionMachine Simulation Features
MillionMachine takes Monte Carlo simulation techniques to the next level, offering tools designed to rigorously test trading strategies without requiring any coding. By integrating advanced randomization methods – like reshuffling, resampling, and even a 5–10% trade skipping feature to mimic real-world execution issues – the platform ensures your strategies are put through their paces.
One standout feature is its Randomized Exit simulations, which keep your entry signals intact but randomize exits. This helps determine if your strategy’s edge is consistent or just a fluke. Additionally, the platform’s Permutation tests use synthetic data to assess whether your strategy’s success is based on historical luck. All results are presented with 95% confidence intervals, giving traders a clear picture of their strategy’s reliability.
Benefits for Traders
MillionMachine is a powerful ally in identifying overfitting. By comparing your backtest results to Monte Carlo distributions, you can spot if your live strategy’s performance starts to veer off course. Such deviations could indicate that your strategy was overly optimized for historical data and isn’t holding up in real-world conditions.
The platform supports testing across five key asset classes – stocks, futures, currencies, ETFs, and crypto – using the same robust simulation tools. Its visual strategy designer allows you to articulate your trading ideas through voice or text, validate rules directly on price charts, and tweak parameters with ease. Plus, it automatically generates detailed, professional-grade reports, offering essential insights without requiring programming skills.
Getting Started with MillionMachine
You can dive into the Monte Carlo tools through the platform’s backtesting interface at https://millionmachine.com. After designing your strategy visually, run simulations to create thousands of alternative equity curves. These curves, displayed as bands, help you monitor live performance and pinpoint deviations. Set your confidence level at 95%, select your preferred simulation method, and adjust the skip rate to fine-tune the analysis. The platform handles all the heavy lifting, allowing you to focus on interpreting the results and refining your trading approach. These tools are designed to seamlessly integrate into your workflow, ensuring that the insights from simulations can directly guide your live trading decisions.
MillionMachine.com is a software platform intended for research, education, and strategy development only. The content on the website and within the platform should not be interpreted as personalized investment advice, trading recommendations, or financial guidance. MillionMachine does not offer advice on the suitability of any strategy, trade, or investment.
Users are fully responsible for evaluating their own trading decisions and risks. All simulations, backtests, and performance metrics generated by MillionMachine are hypothetical and do not guarantee future results. Hypothetical performance has inherent limitations and does not reflect actual trading outcomes, which may differ significantly.
MillionMachine is not registered as a Commodity Trading Advisor (CTA), Investment Advisor, or Broker-Dealer with the NFA, CFTC, SEC, or any other regulatory body. While the founder was previously registered as a CTA with the National Futures Association (NFA), that registration is no longer active, and MillionMachine does not offer regulated advisory services.
MillionMachine does not execute trades, manage customer funds, or provide access to real-time trading accounts. Any integration with broker APIs is strictly for user-initiated automation, with users retaining full responsibility for ensuring compliance with applicable laws, regulations, and broker requirements.
All market data, charts, signals, and analytics provided by MillionMachine are for informational and educational purposes only. MillionMachine does not guarantee the accuracy or completeness of market data and assumes no liability for errors, delays, or omissions.
Trading financial instruments – including futures, stocks, cryptocurrencies, and derivatives – carries significant risk and may not be suitable for all investors. Losses can exceed your initial investment. Past performance, whether actual or simulated, is not indicative of future results.
Conclusion
Key Takeaways
Monte Carlo simulations transform a single backtest into a thorough risk analysis by running 1,000 or more iterations. This often uncovers worst-case drawdowns that can be up to 3.1 times larger than those seen in the original backtest. Using a 95% confidence level is essential for setting realistic expectations for both drawdowns and profits. These simulations also emphasize sequence risk – showing how the order of otherwise identical trades can have a profound impact on overall account performance.
Randomized and permutation tests further validate your strategy by ensuring it isn’t merely optimized to fit historical data noise. When paired with proper capitalization based on the 95th-percentile drawdowns, these tools help traders withstand inevitable losing streaks without abandoning sound strategies too soon. Together, these insights provide a solid foundation for improving your trading approach.
Next Steps for Traders
With these insights in mind, traders should take actionable steps to enhance their strategies. Start by applying Monte Carlo simulations to your current trading methods, using a 95% confidence level as your benchmark for capital allocation. Introduce a 5–10% trade skip rate in your simulations to account for variability. If the simulated drawdown at the 95% confidence level exceeds twice the backtested drawdown, it’s a sign that the strategy carries significant risk.
MillionMachine’s user-friendly interface makes it simple to run these advanced simulations without requiring programming skills. Use the tool to monitor live performance by plotting the 5th and 95th percentile equity bands. If your actual results fall outside these bands, it’s a red flag that your strategy needs re-evaluation. To further reduce risk, combine Monte Carlo testing with a 3–6 month period of paper trading. This allows you to confirm that your strategy’s live performance aligns with simulated outcomes before committing real capital.
MillionMachine.com is designed solely as a tool for research, education, and strategy development. Nothing on this platform – whether on the website or within the software – should be interpreted as personalized investment advice, trading recommendations, or financial guidance. MillionMachine does not offer advice on the suitability of any strategy, trade, or investment.
Users are fully responsible for assessing their own trading decisions and associated risks. All simulations, backtests, and performance metrics generated by MillionMachine are hypothetical and should not be considered guarantees of future results. Hypothetical performance comes with inherent limitations and does not reflect actual trading outcomes. Real-world results may differ significantly from simulated projections.
MillionMachine is not registered as a Commodity Trading Advisor (CTA), Investment Advisor, or Broker-Dealer with the NFA, CFTC, SEC, or any other regulatory body. While the founder was previously registered as a CTA with the National Futures Association (NFA), that registration is no longer active, and MillionMachine does not engage in any regulated advisory activities.
The platform does not execute trades, manage customer funds, or provide access to live trading accounts. Any integration with broker APIs is strictly for user-initiated automation, and users are solely responsible for ensuring compliance with all relevant laws, regulations, and broker requirements.
All market data, charts, signals, and analytics provided by MillionMachine are for informational and educational purposes only. MillionMachine does not guarantee the accuracy or completeness of market data and assumes no responsibility for errors, delays, or omissions.
Trading financial instruments – such as futures, stocks, cryptocurrencies, and derivatives – comes with substantial risk and may not be suitable for every investor. It is possible to lose more than your initial investment. Past performance, whether simulated or actual, is not a reliable indicator of future results.
FAQs
What makes Monte Carlo simulations different from traditional backtesting in trading strategy analysis?
Monte Carlo simulations take strategy testing to the next level by offering a broad statistical range of possible outcomes rather than a single, fixed result. Unlike traditional backtesting, which applies a strategy’s rules to historical data exactly as it unfolded, Monte Carlo simulations mix things up. They might shuffle trade sequences, adjust price paths, or tweak parameters. This creates thousands of alternative equity curves, giving traders a clearer picture of how their strategy could fare under various market conditions – whether it’s a worst-case scenario or simply a mix of luck and skill.
This probabilistic method helps traders evaluate how sturdy their strategies really are. It highlights the chances of experiencing major drawdowns and uncovers overfitting issues that a single backtest might miss. MillionMachine incorporates Monte Carlo analysis alongside standard backtesting, allowing users to rigorously test their strategies across a wide array of scenarios. The goal? To ensure these strategies can handle the ups and downs of the market, not just thrive when conditions are ideal.
What are the benefits of using resampling and reshuffling in Monte Carlo simulations for equity curve analysis?
Resampling and reshuffling techniques in Monte Carlo simulations are powerful tools for generating thousands of alternative equity curve scenarios. By randomizing elements such as trade order, price series, or strategy parameters, these methods shine a light on sequence risk, help spot potential overfitting, and provide a statistical range of possible outcomes.
Using these approaches, you can estimate worst-case drawdowns, assess how resilient your strategy is, and understand how it might behave in different market environments. This type of stress-testing equips you to navigate unpredictable market movements with greater confidence and make smarter, data-driven decisions.
How can traders use Monte Carlo simulations to determine how much capital they need?
Monte Carlo simulations are a powerful tool for traders to gauge the capital they might need to handle potential losses. By running thousands of simulated equity curve scenarios, these simulations can pinpoint the worst-case drawdown with a high degree of confidence – say, at the 95th percentile.
Understanding this drawdown allows traders to calculate the minimum capital required to absorb such losses, steering clear of overleveraging. This method provides a more grounded and practical way to assess capital needs, enabling traders to manage risk with greater precision.


Dave R. on March 8, 2026
Monte Carlo bands are great for spotting when your live curve deviates from backtest expectations, but here’s what I learned the hard way – running thousands of simulations on a single EA just shows you how many ways ONE strategy can fail across different market regimes. I switched to using Ratio X Toolbox on MT5, which gives me 10 different specialized bots instead of forcing one EA to handle trending, ranging, and choppy conditions. My equity curve is way smoother now because I’m actually matching the tool to the market condition rather than hoping my backtest holds up. Are you rotating between different systems based on regime, or sticking with one EA through all conditions?
Mike T. on March 13, 2026
Monte Carlo simulations are essential, but they’re only as good as the EA logic underneath – and that’s where most of us get burned. I’ve tested 20+ EAs chasing that perfect equity curve, only to watch them implode when market regime shifts. The real issue isn’t analyzing performance metrics, it’s that a single EA can’t handle every condition, which is why I switched to running Ratio X Toolbox. Having 10 different strategies means I’m matching the right tool to the market state instead of curve-fitting one bot to death. How many of your backtests account for the hidden cost of over-optimization?