
Analyzing trading performance metrics is essential for understanding your strategy’s strengths and weaknesses. Instead of focusing only on net profit, metrics like Sharpe Ratio, Maximum Drawdown, Profit Factor, and Win Rate reveal how well your strategy balances risk and returns. Here’s a quick breakdown:
- Sharpe Ratio: Measures risk-adjusted returns. A ratio above 1.0 is good, but anything over 3.0 may indicate overfitting.
- Maximum Drawdown (MDD): Shows the biggest loss from a peak. Expect live trading drawdowns to be 1.5× to 2× higher than backtests.
- Profit Factor: Efficiency of profits vs. losses. A score above 1.5 is considered viable.
- Win Rate & Win/Loss Ratio: A high win rate isn’t enough; the size of your wins vs. losses also matters.
- CAGR: Tracks annualized growth over time, smoothing out fluctuations.
Tools like MillionMachine simplify the analysis by automating calculations, testing strategies across markets, and spotting overfitting risks. To refine your strategy, always backtest, compare metrics to benchmarks, and prepare for live trading conditions.
Key Takeaway: Combine metrics to assess risk, consistency, and efficiency. Avoid overfitting and ensure your strategy aligns with your risk tolerance and financial goals.
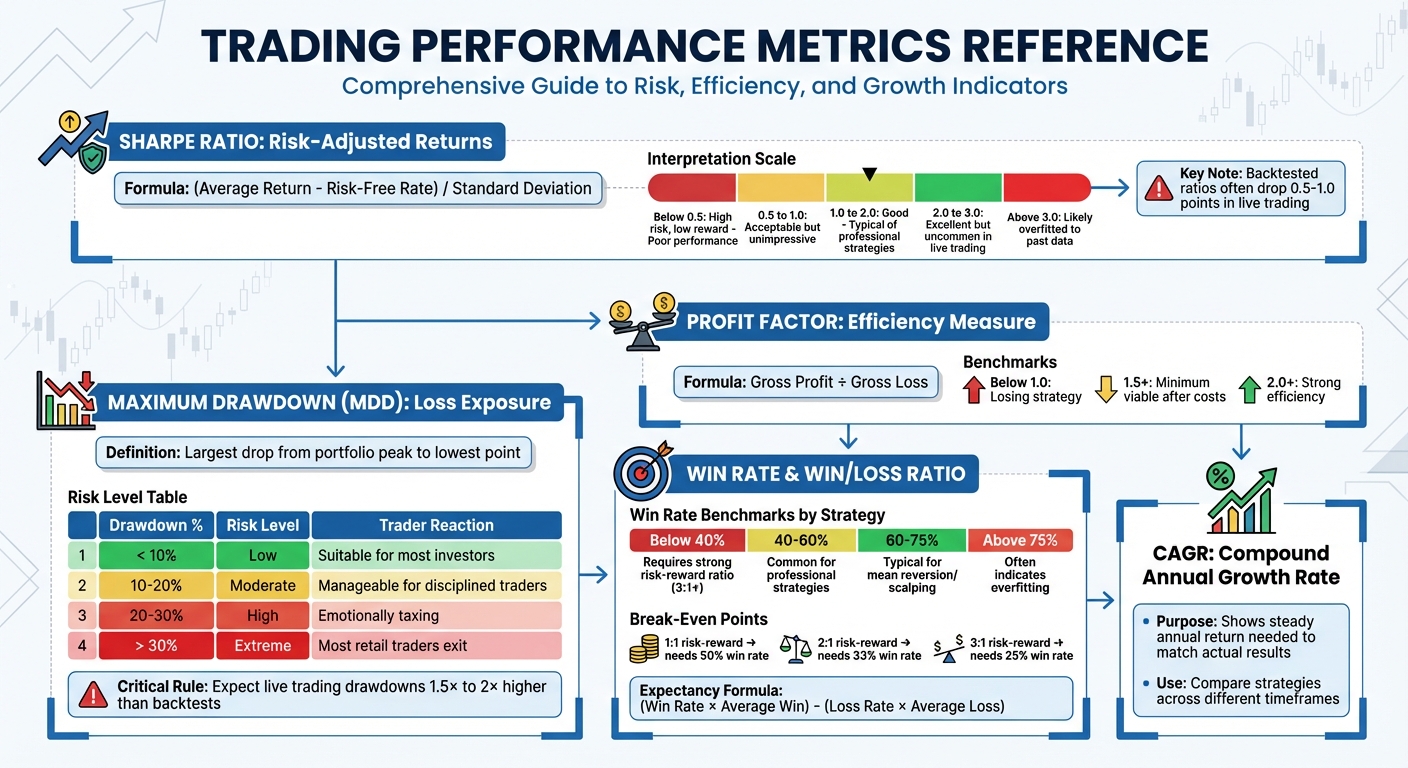
Trading Performance Metrics Quick Reference Guide
Analyzing Trading Strategy Performance Over Time
Core Trading Performance Metrics Explained
Core metrics are the backbone of any trading strategy, helping traders separate effective approaches from those that merely look good on paper. By measuring return, risk, and capital exposure, these metrics paint a clear picture of a strategy’s risk-reward balance.
Sharpe Ratio: Risk-Adjusted Returns
The Sharpe ratio assesses how much return you earn for the level of risk you take. It’s calculated as:
(Average Return – Risk-Free Rate) / Standard Deviation.
This metric is particularly useful for comparing strategies with different return patterns. For example, a strategy with a 15% return and 5% volatility (Sharpe ratio of 3.0) is more attractive than one with a 20% return but 15% volatility (Sharpe ratio of 1.33). The higher ratio indicates better risk-adjusted performance.
Here’s how Sharpe ratios are generally interpreted:
- Below 0.5: High risk, low reward – poor performance.
- 0.5 to 1.0: Acceptable but unimpressive.
- 1.0 to 2.0: Good, typical of professional strategies.
- 2.0 to 3.0: Excellent but uncommon in live trading.
- Above 3.0: Likely overfitted to past data.
One downside? The Sharpe ratio penalizes upside volatility, meaning periods of strong gains can reduce the ratio. It’s also worth noting that backtested Sharpe ratios often drop by 0.5 to 1.0 points when applied to live trading, thanks to slippage and market shifts. For this reason, it’s best used alongside other metrics.
Maximum Drawdown: Understanding Loss Exposure
Maximum Drawdown (MDD) measures the largest drop from a portfolio’s peak to its lowest point, giving traders a clear view of the worst-case loss scenario.
This metric isn’t just about numbers – it’s also a test of emotional resilience. Even a strategy that’s profitable in the long run can be abandoned if its drawdown exceeds a trader’s comfort zone. MDD also determines if a strategy fits your capital. For instance, a $15,000 drawdown is unworkable if you only have $10,000 to risk. And recovering from losses isn’t easy – a 50% drawdown requires a 100% gain to break even.
| Max Drawdown % | Risk Level | Likely Trader Reaction |
|---|---|---|
| < 10% | Low | Suitable for most investors |
| 10–20% | Moderate | Manageable for disciplined traders |
| 20–30% | High | Emotionally taxing; many lose confidence |
| > 30% | Extreme | Most retail traders exit the strategy |
Live trading drawdowns are often 1.5× to 2× higher than backtest results due to slippage and timing issues. As HorizonTrading bluntly puts it:
"If max drawdown is 25% in backtest, expect 35–40% in live trading due to slippage and bad timing. Only trade strategies where you can emotionally handle 1.5× the backtested max drawdown."
To manage risk, many traders set hard stop limits. For example, pausing trading if portfolio drawdown hits 20% allows time to reassess the strategy. Another useful metric is the Recovery Factor – calculated as net profit divided by maximum drawdown. A factor between 2 and 5 is often considered a good balance.
Win Rate and Win/Loss Ratio: Strategy Consistency Indicators
The win rate shows the percentage of trades that are successful, while the win/loss ratio compares the average size of wins to losses. These two metrics together reveal a strategy’s consistency and its ability to generate profits.
However, focusing solely on the win rate can be misleading. A strategy with a 70% win rate might still lose money if its losses are much larger than its wins. Conversely, trend-following strategies can thrive with win rates as low as 40%, as their winners often outweigh their losses by a ratio of 3:1 or more.
Here’s how win rates typically align with strategy types:
- Below 40%: Requires a strong risk-reward ratio to succeed.
- 40–60%: Common for professional strategies.
- 60–75%: Typical for mean reversion or scalping strategies.
- Above 75%: Often a sign of overfitting.
The break-even point depends on the risk-reward ratio. For instance:
- A 1:1 ratio needs a 50% win rate to break even.
- A 2:1 ratio only needs a 33% win rate.
- A 3:1 ratio requires just 25% of trades to win.
To assess overall performance, many traders calculate expectancy with this formula:
(Win Rate × Average Win) – (Loss Rate × Average Loss).
CAGR and Profit Factor: Growth and Efficiency Measures
The Compound Annual Growth Rate (CAGR) smooths out yearly fluctuations, showing the steady annual return needed to match actual results. It’s particularly useful for comparing strategies with different timeframes or projecting long-term growth.
Profit Factor measures how efficiently a strategy generates profits by dividing gross profit by gross loss. A profit factor of 1.5 is often seen as the minimum for a viable strategy after costs. Numbers above 2.0 indicate strong efficiency, while anything below 1.0 signals a losing strategy.
These metrics complement others like the Sharpe ratio and maximum drawdown. For example, a strategy might show an impressive CAGR, but if its profit factor hovers near 1.0 and its drawdown hits 40%, it might be too risky for most traders. Together, these metrics provide a well-rounded view of a strategy’s performance, helping traders make informed decisions with MillionMachine.
Using MillionMachine for Performance Analysis

MillionMachine takes performance analysis to the next level by building on core metrics and presenting them in a user-friendly, visual format. This approach eliminates the need for coding, spreadsheets, or manual calculations. Instead, the platform automates the heavy lifting, allowing traders to focus on testing and refining strategies. Its visual tools also make it easier to verify trading rules in detail.
Visual Strategy Design and Rule Verification
MillionMachine’s visual interface provides a clear picture of how your trading rules perform against historical price data. You can review equity curves, monthly profit charts, and detailed trade lists to ensure your strategy is executing as intended. Every trade – whether long or short – includes details like entry price, exit price, and net profit, helping you confirm that your rules are working as planned.
This clarity also helps you spot issues early. For example, if your strategy is supposed to trigger entries during breakouts but instead enters during consolidations, you’ll notice the problem right away.
Parameter Optimization and Overfitting Tests
Optimization can fine-tune your strategy, but too much tweaking risks overfitting – where a strategy performs well on historical data but fails in live markets. MillionMachine tackles this with Monte Carlo simulations, which shuffle trade sequences to create synthetic equity curves. These simulations help estimate potential returns and drawdowns across a range of scenarios.
Walk-Forward Analysis (WFA) adds another layer of validation by alternating training and testing periods. This ensures your strategy’s performance isn’t just a historical coincidence. A practical tip: if your out-of-sample Sharpe ratio drops by more than 30% compared to in-sample results, overfitting could be an issue. The platform also includes robustness tests, such as slightly adjusting parameters like a 20-day moving average to 21 days. If such small changes drastically affect results, the strategy may lack reliability.
Multi-Asset Performance Analytics
Understanding how strategies perform across different markets is essential for diversification. MillionMachine provides tools to analyze cross-market performance, using correlation matrices to assess portfolio-level risk versus single-strategy exposure.
The platform consolidates performance metrics across five asset classes: stocks, futures, currencies, ETFs, and crypto. This allows you to compare how a mean-reversion strategy performs in equities versus forex or whether a trend-following system works better in commodities than in crypto. Testing strategies across multiple markets helps identify which environments suit your approach best and where adjustments may be necessary. This broad perspective ensures your strategy is ready for real-world conditions.
sbb-itb-e64548c
Step-by-Step Guide to Analyzing Trading Metrics
Step 1: Gather and Organize Your Trading Data
To truly evaluate your trading strategy, you need accurate and comprehensive data. Choose a method to track your trades that suits your workflow. Spreadsheets like Google Sheets or Excel give you full control and come at no cost, while automated tools like Edgewonk, Tradezella, or Tradervue can save time by pulling data directly from your broker, minimizing manual errors.
Your data should include both quantitative details (entry/exit prices, dates, times, stop-loss levels, take-profit targets, net profit, and transaction costs like commissions, fees, and slippage) and qualitative notes (your reasoning for the trade, emotional state, market conditions, and any execution issues). Adding a tagging system to group trades by setup type, instrument (e.g., Forex, Crypto, Stocks), or market conditions can help you pinpoint where your strategy performs best.
"Without data, you’re basically guessing – and that usually leads to inconsistent results." – Rolf, Edgewonk
Make it a habit to log each trade immediately to keep your data accurate. Once you’ve collected enough trades – usually between 20 and 50 – you can start analyzing for patterns and performance trends. As Richard Dennis, author of Trading in the Zone, wisely said:
"You need at least 20 trades before you can really tell if your system works"
With your data in order, the next step is to evaluate your performance against industry benchmarks.
Step 2: Compare Your Metrics to Benchmarks
Assess your trading strategy by comparing its key metrics – like Profit Factor and Sharpe Ratio – against standard benchmarks, such as the S&P 500 or a 60/40 stocks-and-bonds portfolio. A Profit Factor of at least 1.5 is generally desirable, while a Sharpe Ratio above 1.0 signals a solid strategy. If your Profit Factor falls below 1.0, your system is losing money. On the other hand, a Profit Factor between 2.0 and 3.0 is often seen in professional-grade systems. For the Sharpe Ratio, scores below 0.5 indicate poor performance, 1.0 to 2.0 is good, and anything above 3.0 could point to overfitting.
It’s also important to consider the type of strategy you’re running. For example, trend-following systems may have win rates around 40% but rely on higher risk-reward ratios (3:1 or more), while mean reversion systems typically aim for win rates above 70% with lower risk-reward ratios.
A real-world example: From January 2006 to March 2020, The Trader Risk evaluated its "Merlin Trading Strategy" (Margin Portfolio) against a 60/40 benchmark. The strategy achieved a 17.35% compound annual growth rate (CAGR) and a Sharpe Ratio of 1.23, far surpassing the benchmark’s 7.28% CAGR and 0.62 Sharpe Ratio.
Keep in mind the "1.5× rule": if your backtest shows a maximum drawdown of 20%, be prepared for a live trading drawdown closer to 30%, as real-world factors like slippage and fees can amplify losses.
Once you’ve benchmarked your performance, the next step is to test and fine-tune your strategy.
Step 3: Test and Refine Your Strategies
Benchmarking provides a snapshot of where you stand, but the real work lies in testing and refining your approach. Use tools like MillionMachine’s backtesting software to simulate trades under realistic conditions, accounting for brokerage fees, slippage, and interest rates. To avoid over-optimizing, reserve the last 20% of your historical data for a "blind test" to validate your strategy after fine-tuning it on the first 80%.
Look closely at your trade history for outliers. If your results depend heavily on one or two big wins, it’s a sign that your strategy needs more work. A viable system should have an expectancy (average profit per trade) that’s at least two to three times higher than your transaction costs. Before committing real money, spend 1–3 months paper trading to ensure your live results match your backtest performance.
Additionally, tracking the average duration of your trades can help you minimize the impact of commission costs on your overall returns. By testing and refining carefully, you can build confidence in your strategy and improve its long-term viability.
Conclusion
Analyzing trading metrics effectively means looking beyond just net profit. It’s about understanding factors like risk, consistency, and reliability. Metrics such as the Sharpe Ratio, Maximum Drawdown, Profit Factor, and Win Rate help determine whether your returns adequately compensate for the risks involved.
Using a mix of metrics is crucial. For instance, a strategy with a high win rate but a poor risk-reward ratio can still fail, while one with a lower win rate might succeed if it captures significant gains on its wins. Testing your strategy with out-of-sample data is essential, and it’s wise to anticipate live trading drawdowns to be about 1.5 times higher than what your backtests show. These steps provide a solid foundation for evaluating and refining your trading strategies.
MillionMachine simplifies this process with tools for visual strategy design, parameter optimization, and performance analysis across multiple assets. It allows you to verify your rules, avoid overfitting, and fine-tune your approach before risking real money. By leveraging these analytics, you can make better-informed adjustments to build a system that’s both profitable and reliable.
Since markets are always changing, ongoing evaluation and refinement are non-negotiable. With the right tools and a disciplined approach to reviewing your metrics, you can make smarter trading decisions that align with your financial goals and risk tolerance.
MillionMachine.com is designed for research, education, and strategy development. It does not provide personalized investment advice, financial guidance, or recommendations to buy or sell any financial instrument. MillionMachine does not engage in regulated advisory activities or guarantee the accuracy of its analytics or data.
Users are solely responsible for their trading decisions and must understand that all simulations, backtests, and performance metrics are hypothetical. Actual trading results may differ significantly from simulated outcomes. MillionMachine is not registered as a Commodity Trading Advisor (CTA), Investment Advisor, or Broker-Dealer with any regulatory authority.
MillionMachine does not execute trades, manage customer funds, or provide access to real-time trading accounts. Any broker API integrations are strictly for user-initiated automation, with users retaining full responsibility for compliance with laws, regulations, and broker requirements.
Trading financial instruments, including futures, stocks, cryptocurrencies, and derivatives, involves substantial risk and may not suit all investors. You could lose more than your initial investment. Past performance, whether actual or simulated, does not guarantee future results.
FAQs
Why is it important to use multiple metrics when analyzing trading performance?
Relying solely on a single metric, like net profit, can paint an incomplete or even misleading picture of how well a trading strategy performs. To truly understand its effectiveness, you need to look at multiple metrics that assess key factors such as risk, consistency, and efficiency. Here’s why: two strategies might generate the same profit, but one could achieve it with smaller drawdowns and a higher win rate, making it far more sustainable over time.
Metrics like the Sharpe ratio, drawdown, win/loss ratio, and CAGR each shed light on different aspects of a strategy’s performance. When analyzed together, they provide a well-rounded view, helping you spot weaknesses, validate the strategy’s reliability, and make smarter, more risk-conscious decisions. This broader approach allows traders to fine-tune their methods and develop systems that can better withstand the ups and downs of shifting market environments.
How can I tell if my trading strategy is overfitted?
Overfitting happens when a trading strategy looks great during backtesting but falls apart in live trading or out-of-sample testing. One telltale sign of overfitting is a sharp decline in performance metrics – like the Sharpe ratio or win rate – when transitioning from backtesting to forward testing. Another red flag is if the strategy depends too much on a small, specific range of historical data.
To test how reliable your strategy is, consider methods like walk-forward analysis, cross-validation, or Monte Carlo stress testing. These approaches can help verify whether the strategy holds up across various data sets and market conditions.
Why do drawdowns in live trading often differ from backtest results?
When you transition from backtesting to live trading, drawdowns can often look quite different. This happens because live markets introduce variables that backtests simply can’t replicate. Factors like slippage, commissions, latency, order execution differences, market impact, and data quality issues can all come into play, potentially leading to larger losses than anticipated.
While backtests operate under controlled conditions – assuming everything from flawless data to perfect execution – live trading is far less predictable. Sudden price swings, delays in processing orders, or unexpected market behavior can all disrupt a strategy’s performance. It’s crucial to consider these real-world factors when assessing how a strategy might perform in live trading, helping to set more realistic expectations.


Nathan K. on March 11, 2026
Good read on optimization pitfalls. You’re spot on about overfitting – I’ve blown up plenty of backtests that looked perfect in-sample but cratered in live conditions. The real edge comes from testing across different market regimes, not just curve-fitting to historical data. I’ve been running Ratio X Toolbox on MT5 for the past few months, and the multi-EA approach actually forces you to think about regime detection rather than hunting for one magic strategy – each bot has a specific edge profile for trending, ranging, or breakout conditions. Have you tested your strategies across at least a full market cycle, or are you still validating Sharpe ratio improvements?
James W. on June 15, 2026
Solid breakdown on Sharpe ratios and strategy fit. You’re right that win rate alone is misleading—I run trend systems on XAUUSD and a 35-40% win rate is normal when geopolitical volatility spikes mid-session. The real challenge is building logic that adapts to gold’s regime shifts; I used Ratio X EA Generator to code up a custom EA with session-based filters and spread guards that my broker doesn’t support natively. Took a couple of iterations to dial in the parameters, but having MQL5 generated from plain English specs saved me weeks of coding. Are you stress-testing your EAs across both quiet and event-driven gold sessions, or just historical ranges?