
Backtesting helps traders test strategies using historical data to assess their potential performance without risking actual money. Here’s why it matters:
- Understand Performance: Analyze how a strategy might perform under different market conditions (bull, bear, or sideways trends).
- Identify Weaknesses: Spot flaws and worst-case scenarios before live trading.
- Key Metrics: Evaluate profitability (e.g., total return, profit factor), risk (e.g., Sharpe ratio, maximum drawdown), and trade reliability (e.g., win rate).
- Methods: Choose between manual backtesting (time-intensive, good for beginners) or automated tools (faster, requires coding or no-code platforms).
- Data Quality: Use accurate, complete historical data, including fees and slippage, to ensure realistic results.
Backtesting isn’t foolproof but helps refine strategies, reduce risks, and build confidence before live trading. Tools like MillionMachine (visual) or Python libraries (customizable) offer various approaches depending on your needs.
| Quick Comparison | Manual Backtesting | Automated Backtesting |
|---|---|---|
| Ease of Use | Beginner-friendly | Requires coding or tools |
| Speed | Slow | Fast |
| Flexibility | Limited | High |
| Cost | Free | May require investment |
Backtesting is a critical step for any trader aiming to make data-driven decisions and avoid relying on gut feelings.
How to Backtest a Trading Strategy (Step-by-Step Guide) | The Long & The Short Ep. 12
Core Concepts and Performance Metrics
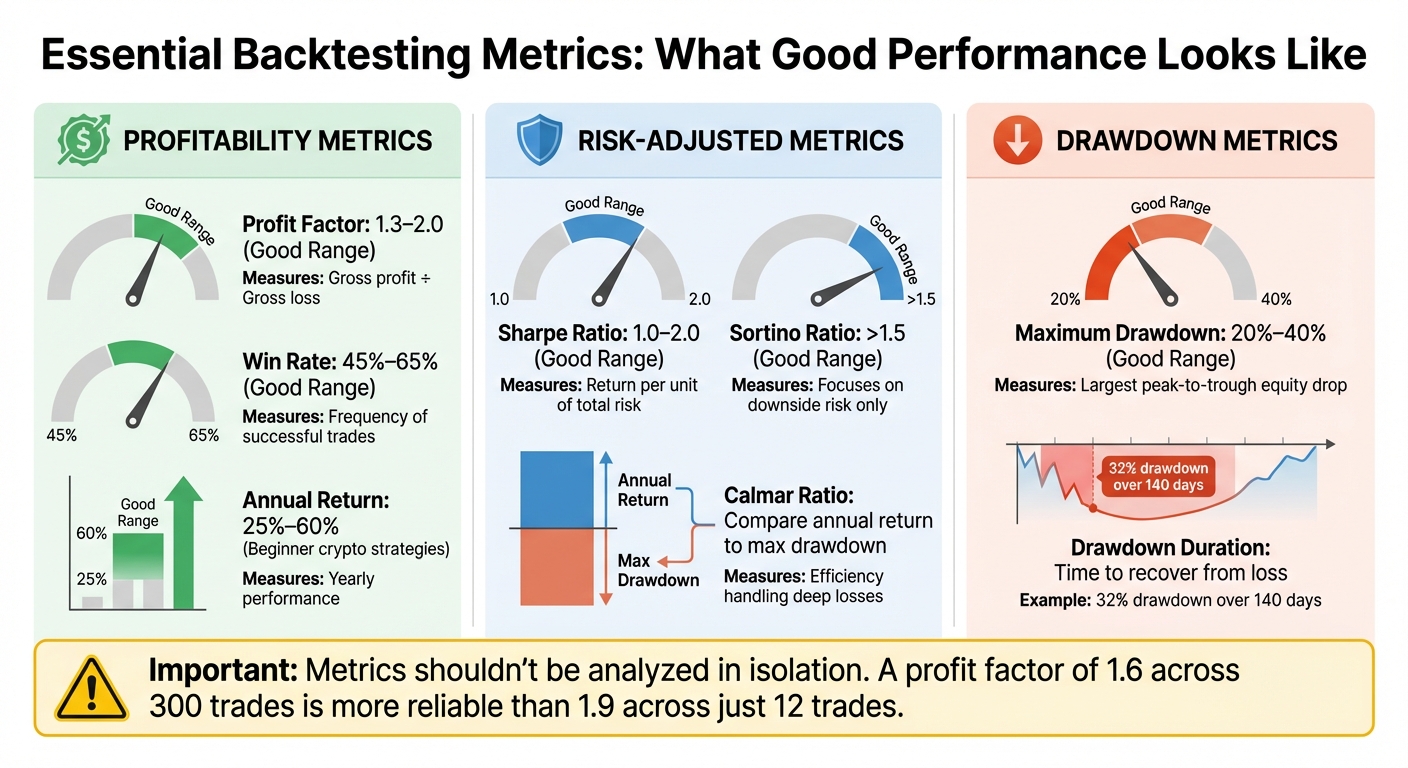
Key Backtesting Performance Metrics and Acceptable Ranges for Trading Strategies
Before diving into any backtest, it’s essential to know exactly what you’re measuring and how to measure it accurately. The metrics you track are the foundation for determining whether a strategy has the potential to succeed in live markets. Backtesting acts as a filter, separating strategies that genuinely work from those that only look good on paper. That’s why understanding these metrics is critical to evaluating the effectiveness of your backtest.
Performance Metrics That Matter
Profitability metrics reveal how much your strategy could earn. Total return reflects the overall gain or loss, while annualized return adjusts this to a yearly scale, making it easier to compare strategies tested over different time periods. For instance, beginner-friendly crypto strategies often show annual returns between 25% and 60%. Pairing win rate with the average profit and loss per trade gives a clearer picture of performance. Another key metric is the profit factor, which divides gross profit by gross loss. Values above 1.0 indicate profitability, with a healthy range typically falling between 1.3 and 2.0.
Risk-adjusted metrics determine whether the returns are worth the risks taken. The Sharpe ratio measures the return per unit of total volatility, with values between 1.0 and 2.0 generally being favorable. The Sortino ratio takes this a step further by focusing only on downside volatility – ignoring the "good" price swings. The Calmar ratio, on the other hand, compares annualized returns to the maximum drawdown, providing insight into how efficiently a strategy handles deep losses.
Drawdown metrics measure the potential "pain" a strategy might inflict. Maximum drawdown (Max DD) represents the largest peak-to-trough equity drop – the worst-case scenario the strategy has encountered. Many effective strategies have maximum drawdowns ranging from 20% to 40%. Drawdown duration, which tracks how long it takes to recover from a loss and hit a new equity high, is equally important. For example, if a strategy experiences a 32% drawdown over 140 days, you need to assess whether you have the patience and discipline to stick with it.
| Metric | "Good" Range | What It Tells You |
|---|---|---|
| Sharpe Ratio | 1.0–2.0 | Return per unit of total risk |
| Sortino Ratio | > 1.5 | Focuses on downside risk |
| Profit Factor | 1.3–2.0 | Reliability of profits over losses |
| Win Rate | 45%–65% | Frequency of successful trades |
| Max Drawdown | 20%–40% | Maximum historical equity drop |
Metrics shouldn’t be analyzed in isolation. For example, a profit factor of 1.6 across 300 trades is far more reliable than a 1.9 profit factor based on just 12 trades. And if your metrics seem too good to be true – like an unusually high Sharpe ratio with no drawdown – double-check for overlooked factors like trading fees, unrealistic execution assumptions, or overfitting to historical data.
Manual vs. Automated Backtesting
Manual backtesting involves reviewing historical charts and recording hypothetical trades. This approach is great for beginners who want to build trading intuition or for strategies that rely on subjective criteria that are hard to code. However, it’s time-consuming and prone to human error.
Automated backtesting, on the other hand, uses software or programming (e.g., Python or Pine Script) to apply predefined rules to historical data instantly. This method eliminates emotional bias, speeds up iterations, and can handle large-scale testing across thousands of trades in seconds. The downside? It requires coding knowledge or an investment in paid tools, and setting it up can take time.
For those without coding experience, no-code platforms provide a middle ground. These platforms use visual interfaces to design and test strategies without programming. They work well for standard approaches like dollar-cost averaging or grid trading but may lack the flexibility needed for more complex strategies. A common progression for traders is to start with manual testing to develop and refine ideas, move to no-code tools for simpler strategies, and eventually adopt coding for more advanced or large-scale research.
No matter which method you choose, the accuracy of your backtest depends on the quality of the data you use.
Historical Data Requirements
The success of a backtest rests on the reliability of its historical data. Poor-quality data can lead to misleading results, making a strategy appear promising when it’s not. Issues like corrupted price feeds, incomplete datasets, or rounding errors can create false signals. Metrics like the Sharpe ratio or maximum drawdown are only as reliable as the data they’re based on.
A solid backtest requires detailed price data, including OHLC (Open, High, Low, Close), volume data for liquidity analysis, and precise timestamps to capture key market events. For stocks, adjustments for dividends, stock splits, and mergers are essential to avoid skewed results. Even small factors like exchange fees or spreads can turn a +0.4% profit per trade into a loss if ignored.
Always source data from trusted providers, such as established exchanges or well-known vendors. Include delisted or failed assets in your dataset to avoid survivorship bias, which can make a strategy look overly optimistic if only successful assets are considered. Match the data resolution to your strategy’s needs – use tick-by-tick or one-minute data for intraday strategies, while OHLCV candles are usually sufficient for swing or long-term approaches. Manually check for missing data, verify timestamps, and remove anomalies like sudden price spikes that could trigger false signals.
How to Build a Backtesting Framework
Creating a backtesting framework involves coding precise trading rules, preparing high-quality data, and accurately recording simulated trades. This framework ties together three essential components: well-defined strategy rules, properly prepared data, and a reliable system for logging every simulated trade. These elements work in harmony to produce reliable results and align with earlier discussions on backtesting metrics, ensuring thorough evaluation.
Setting Up Strategy Rules
Your trading strategy should have rules that are crystal clear and leave no room for interpretation. Avoid vague phrases like "price looks strong" and instead use specific conditions like "price closes 1% above the prior high". The goal is for a computer to execute decisions without ambiguity.
Define every detail: the asset, timeframe, indicator values, and entry/exit triggers. For example, "buy when the 14-period RSI crosses above 30 on the daily chart". Position sizing must also be pre-determined. Whether you’re risking a fixed percentage of your capital (e.g., 2% per trade) or using a volatility-based approach like the Average True Range (ATR), these decisions need to be made upfront.
Risk management is non-negotiable. As mentioned earlier, precise rules eliminate guesswork. Protective stop-losses should be set using either a fixed percentage (e.g., 3% below entry) or an ATR-based distance (e.g., 2× ATR). Similarly, define take-profit levels in advance. Without these parameters locked in, you’re not truly backtesting – you’re just experimenting.
Choosing and Preparing Data
The type of data you use should align with your strategy. For trend-following or swing trading, OHLCV data (Open, High, Low, Close, Volume) is usually sufficient. It’s compact and processes quickly, though it lacks details like intra-candle movements and bid-ask spreads. Scalping or market-making strategies, however, often require Order Book snapshots to capture spread and depth, though these datasets demand more storage and computational resources.
Data preparation is critical. Clean your data by removing missing candles, filtering out price spikes, and eliminating bad ticks. If you’re merging data from multiple exchanges, standardize symbols and timestamps. For stock data, adjust for splits and dividends to avoid skewed results. Include delisted or failed assets – testing only on surviving stocks can give a false sense of performance and overlook real-world risks.
Don’t forget to model real-world trading frictions. Account for exchange commissions, bid-ask spreads, and slippage in your simulations. For instance, a strategy showing a modest 0.4% profit per trade might turn unprofitable when you factor in a 0.2% commission and 0.3% slippage. Ignoring these frictions can make your results misleading. Robust data preparation is essential for generating meaningful performance metrics.
Running Tests and Recording Results
With your rules defined and data prepared, it’s time to run the backtesting simulation. Input your strategy rules into your chosen system – whether it’s a manual spreadsheet, a no-code platform, or a Python script. Set the date range, apply your entry and exit conditions, and let the system simulate trades based on historical data. The system should execute trades exactly as your rules specify, without any manual adjustments.
Keep detailed logs of every trade. Record the date, entry and exit prices, position size, profit or loss (both in dollars and percentages), and the reason for exiting the trade. This trade log is the foundation for calculating key performance metrics like profit factor, maximum drawdown, and the Sharpe ratio. To ensure statistical reliability, aim for at least 30–50 trades.
After running the simulation, validate your results using a holdout dataset – a portion of historical data that wasn’t used to develop the strategy. This Out-of-Sample test serves as a final check to confirm that your strategy isn’t overfitted to past data. If the Sharpe ratio for the Out-of-Sample period drops by more than 30% compared to the In-Sample period, it’s a red flag that the strategy may not perform well in live markets.
Backtesting with MillionMachine and Python
When your backtesting framework is ready, the next step is selecting a platform to run your tests. You have two main options: visual platforms that require no coding or Python libraries that give you complete control through programming. Each approach has its own strengths, depending on your technical expertise and testing goals. Let’s explore the benefits and limitations of each.
Visual Backtesting with MillionMachine
For those who prefer simplicity, MillionMachine provides an intuitive, point-and-click interface for testing strategies. You can outline your trading ideas in plain language or use visual rule design to specify entry and exit conditions. The platform visually verifies your rules on price charts, allowing you to see when trades would trigger before conducting a full backtest.
MillionMachine supports testing across multiple asset classes, including stocks, futures, currencies, ETFs, and cryptocurrencies. After running a test, you receive professional-grade performance reports with metrics like profit factor, Sharpe ratio, and maximum drawdown – metrics that are key to evaluating strategy performance. A standout feature is its built-in Monte Carlo overfitting test, which runs thousands of randomized simulations to determine if your strategy’s success is due to genuine merit or just luck.
Additionally, MillionMachine simplifies parameter optimization. Instead of manually tweaking variables and re-running tests, the platform automates the process, identifying the best-performing settings from historical data. This saves you hours of effort and helps pinpoint robust parameter ranges.
Python Backtesting Libraries
For traders who prefer a hands-on approach, Python offers powerful tools like Backtrader and Zipline-Reloaded. These open-source libraries are favorites among retail quants due to their flexibility and control over execution logic.
Backtrader, for instance, mimics broker behavior, accounting for factors like slippage, commissions, and advanced order types. It uses an event-driven architecture, where you set up a backtest by creating a Cerebro instance (e.g., bt.Cerebro()), defining your starting capital, loading historical data, and subclassing bt.Strategy to define your trading logic. Indicators like moving averages are declared in the init method, while entry and exit rules go into the next() method. Once set, you can run the backtest and visualize the results with built-in plotting tools. Backtrader is entirely free and open-source.
Zipline-Reloaded, a community-maintained version of Quantopian‘s Zipline, supports a wide range of assets. It uses functions like initialize(context) for setup and handle_data(context, data) for bar-by-bar logic. A significant advantage is its access to 10 years of minute-level U.S. stock data, included in its environment. Like Backtrader, it’s free and open-source.
These libraries require a solid understanding of Python, which can make the learning curve steep. However, this technical challenge comes with rewards: unlimited flexibility. You can implement custom logic, integrate external data sources, and test portfolios spanning multiple assets, tailoring everything to meet your specific needs.
MillionMachine vs. Python: Feature Comparison
Choosing between MillionMachine and Python depends on your technical skills, available time, and testing requirements. Here’s a side-by-side comparison to help you decide:
| Feature | MillionMachine | Python (Backtrader/Zipline) |
|---|---|---|
| User Interface | Visual, no-code platform | Programmatic (code-based) |
| Ease of Use | High (drag-and-drop rules) | Moderate to low (requires coding) |
| Learning Curve | Minimal | Steep (requires Python knowledge) |
| Customization | Limited to platform features | Unlimited via custom code |
| Overfitting Tests | Built-in Monte Carlo tests | Requires custom implementation |
| Multi-Asset Testing | Supported across 5 asset classes | Supported (manual setup needed) |
| Time Investment | Low (quick setup) | High (development and debugging) |
| Cost | Subscription-based | Free (open-source) |
For realistic simulations that account for brokerage constraints, commissions, and slippage, Backtrader’s event-driven architecture is a strong choice. On the other hand, if you’re conducting large-scale research with thousands of parameter combinations, libraries like VectorBT can execute tests at lightning speed.
The backtesting software market is booming, with projections estimating it will reach $5 billion by 2027, growing at an annual rate of 12.5%. This growth underscores the increasing demand from traders – both retail and institutional – who understand the importance of thorough backtesting before putting real money on the line.
sbb-itb-e64548c
Analyzing and Improving Backtest Results
Once your backtest is complete, it’s time to dig into the results. Think of your performance report as more than just a collection of stats – it’s a diagnostic tool that helps you figure out if your strategy’s edge is real or just a lucky fluke. Start by looking at your total return and the profit factor. A profit factor between 1.3 and 2.0 typically points to a system that’s both realistic and reliable. If your total return looks impressive but the profit factor dips below 1.3, it could mean that a few big wins are masking frequent losses.
You’ll also want to assess risk-adjusted returns using metrics like the Sharpe ratio (reward-to-volatility) and the Sortino ratio (focused on downside risk). Sharpe ratio values between 1.0 and 2.0 are often considered solid for trading strategies. Don’t overlook maximum drawdown and drawdown duration – compare these against your acceptable thresholds. The Calmar ratio (annual return divided by maximum drawdown) is another helpful measure to decide if the potential rewards are worth the risks of historical losses.
This initial review lays the groundwork for a more detailed examination of your backtest results.
Reading Performance Reports
Profitability alone doesn’t tell the full story. You need to confirm that your strategy’s edge is statistically significant. A p-value below 0.05 on daily returns suggests that your performance is likely driven by a genuine edge rather than random chance. To test how robust your system is, try tweaking input variables. For example, if changing a 50-period moving average to 48 or 52 causes performance to tank, it’s a red flag that your strategy might be too sensitive to specific parameters. For beginner-friendly systems, realistic win rates usually fall between 45% and 65%, while strong crypto strategies often deliver annual returns between 25% and 60%.
Out-of-Sample Testing and Walk-Forward Analysis
To further validate your findings, incorporate out-of-sample testing and walk-forward analysis. Always set aside an out-of-sample (OOS) dataset as a final “truth test” to avoid overfitting. If your out-of-sample Sharpe ratio is more than 30% lower than your in-sample Sharpe ratio, it’s a sign that your strategy might be overfit to historical data.
Walk-forward analysis (WFA) takes this a step further by using a rolling window approach. You optimize your strategy on one segment of data, test it on the next, and then move the window forward to repeat the process. This method helps you see whether your strategy can adjust to changing market conditions or if it’s just memorizing historical patterns.
"A backtest is a filter, not a promise. Only strategies that survive clean data, conservative assumptions, and forward testing are candidates for live trading." – Wijdan Khaliq
Monte Carlo Testing for Strategy Durability
Monte Carlo simulations add another layer of testing by examining how your strategy performs under varying conditions. These simulations shuffle trade sequences to create thousands of alternate scenarios, helping you figure out if your backtest results were due to a specific order of trades rather than a true trading edge. Running at least 1,000 simulations ensures statistical reliability.
Use the results to plot 5th and 95th percentile equity bands, forming a "probability cone." If your live trading results fall outside this range, it could mean your strategy is underperforming or facing unexpected stress. Monte Carlo analysis also reveals that your observed maximum drawdown might not tell the whole story – simulations often show potential drawdowns up to 3.1 times larger than what your backtest recorded.
"The purpose of Monte Carlo Simulation is to detect lucky backtests and misleading performance metrics before risking real capital." – David Bergstrom, Founder, Build Alpha
Common Mistakes and How to Avoid Them
When it comes to backtesting, even small missteps can lead to big misjudgments about a strategy’s effectiveness. These errors can make a strategy seem like a winner on paper but fail miserably in live markets. Here’s a closer look at common pitfalls and how to steer clear of them.
Eliminating Data Biases
Lookahead bias occurs when your backtest relies on future data that wouldn’t have been available at the time of the trade. For example, if a strategy triggers a buy at the close but records the entry at the next bar’s open, it’s essentially “cheating” by using future information. To avoid this, make sure signals trigger at the close and are filled at the next bar’s open or at a realistic limit price.
Survivorship bias is another trap. This happens when you test only on stocks or cryptocurrencies that are still active today, ignoring those that went bankrupt, were delisted, or acquired. By excluding these underperformers, your results can look much better than they should. The fix? Use a historical dataset that includes securities as they existed during the test period, even if they no longer exist today.
Overfitting, also known as data snooping, is when a strategy is excessively tailored to historical data, resulting in stellar backtest results but poor live performance. A telltale sign of overfitting is when the out-of-sample Sharpe ratio drops by more than 30% compared to the in-sample ratio. To combat this, reserve the last 20–30% of your data exclusively for validation purposes.
Once biases are addressed, it’s crucial to account for real-world trading costs to ensure your backtest reflects reality.
Adding Transaction Costs and Slippage
Overlooking transaction costs is a surefire way to overestimate profitability. For instance, a strategy showing a +0.4% return per trade before costs might end up flat – or even negative – once you factor in a 0.1% fee per side and typical market spreads. To keep things realistic, model every trade with explicit exchange fees, bid-ask spreads, and conservative slippage estimates.
"Traders should bear in mind that real trades incur fees which may not be included in backtests. Therefore, you need to account for these trading costs when performing these simulations as they will affect your profit-loss (P/L) margins on a live account." – Ntokozo Ngubeni, Financial Writer, IG
For strategies like scalping, standard OHLCV data often falls short. In these cases, using higher-quality data and applying liquidity filters can prevent unrealistic assumptions about “perfect fills” in low-volume markets.
Testing Across Different Market Conditions
Even with biases and costs accounted for, testing a strategy in just one type of market condition – like a bull market – can give you a false sense of confidence. A strategy that thrives in an uptrend might crumble in a bear market or during sideways, choppy periods. To ensure durability, use walk-forward analysis, alternating between training and testing periods, and reserve out-of-sample data for validation.
Stress-testing your strategy under extreme conditions, like the 2008 financial crisis or the 2020 flash crash, can reveal vulnerabilities. It’s also wise to test across various timeframes – such as 5-minute and 1-hour charts – to confirm your strategy isn’t overly dependent on a specific data frequency. Finally, tweak key inputs by ±10% to check for fragility and ensure your strategy can handle slight variations.
Conclusion
Strategy backtesting serves as a powerful diagnostic tool, helping traders separate mere assumptions from actionable insights. By simulating strategies against historical data, you can assess whether a trading approach has genuine potential or is simply based on intuition. This process involves setting clear rules, factoring in fees and slippage, and testing performance across various market conditions – bullish, bearish, and sideways. It’s a methodical way to validate strategies before risking real capital.
The four-step framework outlined – defining rules, preparing data, running tests, and analyzing results – provides a structured approach to evaluate strategies effectively. Advanced techniques like walk-forward analysis and Monte Carlo simulations, as discussed earlier, further ensure that your strategy holds up under diverse conditions, rather than being overly optimized for a specific historical period. Incorporating transaction costs and testing across multiple market regimes helps avoid the pitfall of strategies that seem flawless in theory but fail in practice.
"Backtesting is the rudder that guides strategy development. Yet, a naïve backtest can give a false sense of confidence." – Sarah Lee
Tools like MillionMachine simplify the backtesting process, offering features like visual strategy design, parameter optimization, and built-in overfitting checks. This allows you to refine your ideas in a fraction of the time – no coding required. Whether you’re experimenting with a basic moving average crossover or fine-tuning a complex, multi-asset portfolio, platforms like this let you focus on identifying strategies that are grounded in reality.
After completing your backtests, consider paper trading for 3–6 months to test execution and discipline. Once confident, transition to live trading with a small portion of your capital – typically 1%–5%. Keep in mind that while backtesting doesn’t guarantee future success, it’s an essential step in filtering out weak strategies before they result in real losses.
MillionMachine.com is designed for research, education, and strategy development purposes only. Nothing on the website or its platform should be seen as personalized investment advice, trading advice, or a recommendation to buy or sell any financial asset. MillionMachine does not provide guidance on the suitability of any strategy, trade, or investment.
Users are fully responsible for evaluating their trading decisions and risks. All simulations, backtests, and performance metrics generated by MillionMachine are hypothetical and not indicative of future results. Hypothetical performance has limitations and does not reflect actual trading outcomes, which may vary significantly.
MillionMachine is not registered as a Commodity Trading Advisor (CTA), Investment Advisor, or Broker-Dealer with the NFA, CFTC, SEC, or any other regulatory authority. While the founder was previously registered as a CTA with the National Futures Association (NFA), that registration is no longer active, and MillionMachine does not engage in any regulated advisory activities.
MillionMachine does not execute trades, manage customer funds, or provide access to live trading accounts. Any integrations with broker APIs are strictly for user-initiated automation. Users are responsible for ensuring compliance with all applicable laws, regulations, and broker requirements.
All market data, charts, signals, and analytics displayed by MillionMachine are for informational and educational purposes only. The platform does not verify the accuracy or completeness of market data and assumes no responsibility for errors, delays, or omissions.
Trading financial instruments – including futures, stocks, cryptocurrencies, and derivatives – carries significant risk and may not be suitable for all investors. Losses can exceed your initial investment. Past performance, whether simulated or actual, is not a reliable indicator of future results.
FAQs
What’s the difference between manual and automated backtesting?
Manual and automated backtesting each come with their own set of strengths and limitations, especially when it comes to speed, accuracy, and scalability.
With manual backtesting, traders review historical price data and apply their strategy rules manually. This method offers a hands-on approach, giving traders the flexibility to make real-time adjustments and interpret data in a nuanced way. However, it’s incredibly time-intensive, prone to human error, and not practical for analyzing large datasets or juggling multiple strategies at once.
Automated backtesting, in contrast, relies on algorithms to quickly and consistently process vast amounts of historical data. This approach removes emotional bias and reduces the likelihood of errors, making it a more dependable choice for testing several strategies or variations. That said, its effectiveness hinges on the quality of the code and data used, and it doesn’t offer the same adaptability as manual testing when it comes to making on-the-fly adjustments.
How can I make sure the historical data I use for backtesting is accurate and reliable?
To get accurate and dependable backtesting data, it’s essential to obtain it from trusted, high-quality sources. Make sure the dataset is comprehensive, accounts for corporate actions like stock splits and dividends, and aligns with the correct time zones. It’s a good idea to cross-reference this data with an independent source to spot and fix any gaps, errors, or missing entries. These precautions help protect the reliability of your backtesting results and lead to more dependable strategy assessments.
What are the most important metrics to evaluate when backtesting a trading strategy?
When reviewing a backtest, it’s crucial to zero in on specific performance metrics to gauge how well the strategy performs and manages risk. Start with total profit/loss, which gives a quick overview of the strategy’s overall returns. Then, consider the win rate – the percentage of trades that were profitable – and the profit factor, which compares gross profits to gross losses to assess consistency.
Risk management metrics are just as critical. Pay attention to the maximum drawdown, which reveals the largest drop from a peak to a trough during the testing period. To dig deeper into how returns stack up against risks, examine risk-adjusted ratios such as the Sharpe ratio, Sortino ratio, or Calmar ratio. Together, these metrics paint a clearer picture of the strategy’s performance and its potential vulnerabilities.


backtrex on March 30, 2026
Comprehensive guide. Worth emphasizing the difference between backtesting for discovery vs validation. Discovery = “does any edge exist here?” Validation = “will this specific set of rules work going forward?” Most traders skip straight to validation without doing proper discovery first, which leads to premature optimization.
Gabriel C. on June 7, 2026
Solid article on separating assumptions from actual edge. I’ve passed two prop challenges and can tell you the backtesting part is crucial, but what kills most traders is how their strategy behaves during drawdown phases – something historical data alone doesn’t always reveal. I’ve been stress-testing my setups with Ratio X Toolbox (www.ratioxtrade.com), specifically the MLAI 2.0 EA which has built-in scenario analysis for different market regimes, and it’s helped me understand where my logic actually breaks down versus where I just got lucky. Have you found backtesting platforms that let you test beyond just “did it win” to “would it survive my equity curve rules”?