
Want to improve your trading strategy? Here’s the bottom line: Optimization is about refining your system to balance risk and returns effectively. Whether you’re trading stocks, futures, or crypto, these practices can help you avoid common pitfalls like overfitting and ensure your strategy is built to handle market challenges.
Key Takeaways:
- Set Clear Goals & Limits: Define your objectives and risk thresholds before starting. For example, aim for a 15% annual return with a max drawdown of 10%.
- Realistic Backtesting: Use high-quality data, account for fees and slippage, and test under different market conditions.
- Avoid Overfitting: Focus on parameter stability, not just peak performance. Test with out-of-sample data and walk-forward analysis.
- Incorporate Risk Management: Use position sizing rules like the "1% Rule" to limit risk and manage volatility.
- Validate with Walk-Forward Testing: Simulate how your strategy adapts to changing markets using rolling data windows.
- Measure Success with Risk-Adjusted Metrics: Metrics like Sharpe Ratio (>1.0) and Profit Factor (>1.75) help evaluate performance beyond raw returns.
- Leverage Tools Like MillionMachine: Automate backtesting and optimization for faster, more accurate results.
- Monitor Live Performance: Compare live results to benchmarks and adjust cautiously, avoiding impulsive tweaks.
- Test Across Multiple Markets: Ensure your strategy works across different assets to reduce overfitting.
Quick Comparison Table:
| Practice | Why It Matters | Key Tip |
|---|---|---|
| Set Goals & Limits | Prevents wasted time and risky strategies | Use the 3-5-7 Rule for risk management |
| Realistic Backtesting | Avoids inflated results | Include transaction costs and slippage |
| Avoid Overfitting | Ensures reliability in live trading | Test with out-of-sample data |
| Risk Management | Protects capital | Limit risk to 1% per trade |
| Walk-Forward Testing | Mimics real market dynamics | Use rolling data windows |
| Risk-Adjusted Metrics | Evaluates true performance | Focus on Sharpe Ratio and Max Drawdown |
| Automation Tools | Saves time and reduces errors | Use platforms like MillionMachine |
| Live Performance Tracking | Identifies issues early | Monitor key metrics like Profit Factor |
| Multi-Market Testing | Confirms strategy robustness | Test across stocks, futures, and crypto |
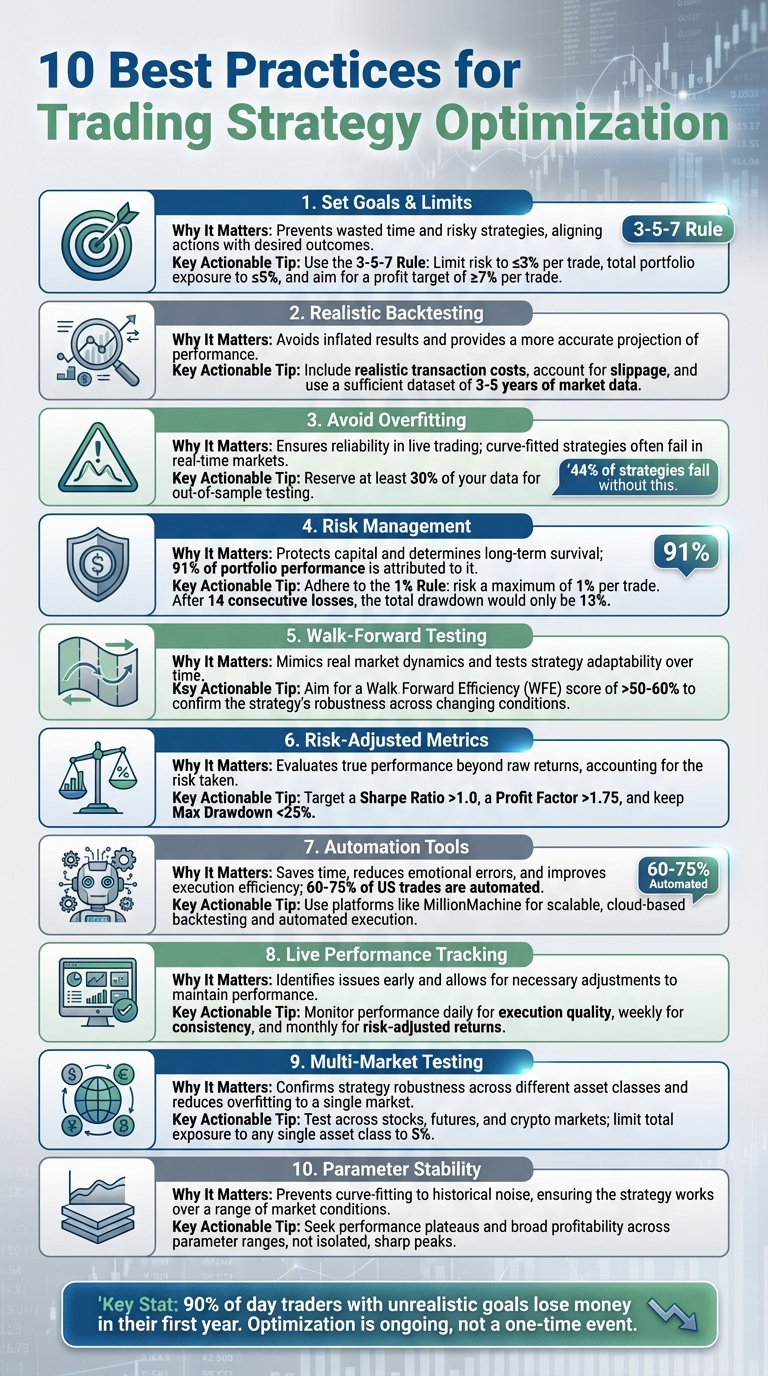
10 Trading Strategy Optimization Best Practices: Key Metrics and Tips
8 Ways to Improve your Backtesting and Optimization Process | Trading Strategy Development
1. Define Your Goals and Limits Before You Start
Crafting an effective strategy starts with setting clear, measurable goals and defining strict risk limits. Before tweaking parameters or running backtests, ask yourself one key question: what are you trying to achieve? Without a clear purpose and boundaries, you’re likely to waste time and end up with strategies that don’t hold up in real-world conditions. Well-defined objectives are the foundation for every decision you’ll make during the optimization process.
First, pinpoint your primary focus. Are you aiming for profit generation, risk management (like hedging existing positions), or managing capital flows for a fund? Then, decide whether you’re prioritizing outcome goals (e.g., achieving a 15% annual return) or process goals (like ensuring disciplined execution and quality trades). Both are important, but understanding which one takes precedence will guide your approach.
Set non-negotiable risk limits. For instance, establish a maximum drawdown threshold – say, 10–15% of your account – and discard any strategy that exceeds it. Follow the 3-5-7 rule: limit risk to ≤3% per trade, keep total exposure ≤5%, and aim for at least a 7% profit on winning trades to maintain a favorable risk-reward ratio. These aren’t just guidelines; they’re the protective measures that safeguard your capital and keep emotions in check during volatile market periods.
"Clarity in your objectives will help guide your strategy development and optimization process effectively." – uTrade Algos
Your goals should also align with your risk tolerance and available capital. For example, a conservative investor might target around 10% annual returns, while smaller accounts could aim for closer to 30% growth. To calculate the capital you’ll need, use this formula: (Max Drawdown × 1.5) + (2 × Margin Requirements). This buffer ensures your strategy can endure market swings without running out of resources.
Keep in mind that 90% of day traders chasing overly ambitious returns lose money within their first year. Setting realistic, achievable goals is the cornerstone of building a sustainable trading strategy.
2. Build a Realistic Backtesting Process
The reliability of a backtest depends entirely on the quality of the data and the assumptions behind it. If you’re working with overly clean data and overlooking real-world challenges like commissions and slippage, you’re setting yourself up for failure when it’s time to trade live. The real goal isn’t to show off paper profits – it’s to figure out which strategies can truly handle the ups and downs of the market and which ones will crumble under realistic conditions. Here’s how to make sure your backtest mirrors the real trading environment.
Start with complete, high-quality historical data. This includes data on delisted or bankrupt companies. Ignoring these cases introduces survivorship bias, which can inflate your performance metrics unfairly. For example, if you’re testing a stock-picking strategy from 2008–2010 but only include companies still trading today, you’re leaving out those that went under during the financial crisis – this skews your results and gives a false sense of success.
Factor in all transaction costs. Every trade in your backtest should account for costs like commissions, spreads, and slippage. Even seemingly small fees can pile up over time, significantly cutting into profitability. These costs are often underestimated, but over hundreds or thousands of trades, they can drastically alter the appearance of a strategy’s success.
Add execution realism. Trading in the real world isn’t as clean as pressing a button and getting the exact price you want. Your backtest needs to include factors like latency, tick sizes, margin requirements, and the reality that you won’t always get filled at the price shown in historical data. Also, avoid future-data leakage by eliminating look-ahead bias. This means your backtest should only use information that would have been available at the time of the trade – no revised economic data or restated earnings.
Test under varied market conditions. A strategy might shine in a bull market but struggle when volatility spikes or the market goes sideways. To get a full picture, test your strategy across bull, bear, and flat markets with different levels of volatility. For day trading strategies, aim for at least 500 trades over a 6–12 month period. For longer-term strategies, use 3–5 years of data. This type of rigorous testing helps you understand how your strategy performs under different scenarios and sets the stage for further fine-tuning.
3. Optimize Parameters Carefully, Not Excessively
When it comes to parameter tuning, many traders unintentionally sabotage their strategies. It’s easy to fall into the trap of constantly tweaking settings to maximize historical returns. But this approach often leads to a system that excels at "remembering" past data rather than reflecting real market behavior. A stark example of this is the 2012 incident with Knight Capital, which lost $440 million in just 45 minutes due to an overfitted algorithm that looked great in testing but failed catastrophically in live trading.
The smarter move is to focus on identifying parameter plateaus rather than chasing isolated performance peaks. Instead of zeroing in on a single best-performing value – like a 14-period moving average that delivers a 1.2 Sharpe ratio – look for a range where performance stays stable. For instance, if shifting from 14 to 12 or 16 periods causes your Sharpe ratio to plummet to -0.2, that’s a red flag. It likely means your strategy is overly fine-tuned to historical data quirks. A robust strategy should perform consistently across a range of settings, indicating it reflects genuine market dynamics rather than fleeting patterns.
"Whatever optimal parameters one found are likely to suffer from data snooping bias, and there may be nothing optimal about them in the out-of-sample period."
- Ernest Chan, Founder, PredictNow.ai
Simplicity plays a crucial role in maintaining effective risk management. Adding unnecessary parameters often leads to noise fitting, which weakens your strategy. Studies show that 44% of trading strategies fail out-of-sample testing, primarily because they were over-optimized with too many rules and indicators. In practice, a strategy with just three well-chosen parameters is far more reliable in live trading than one overloaded with fifteen.
Another essential practice is setting aside 30% of your data for out-of-sample testing. This reserved dataset acts as a reality check. If your carefully tuned parameters don’t hold up when tested on unseen data, it’s a strong indicator that your model is overfitted. Out-of-sample testing ensures your strategy captures real predictive value instead of being overly tailored to a specific slice of market history.
4. Test for Overfitting Using Multiple Methods
Once you’ve narrowed down your parameters, it’s time to ensure your strategy isn’t just memorizing historical data. This is where using multiple testing methods becomes crucial.
Start with out-of-sample testing – a fundamental step in spotting overfitting. Set aside 20% to 30% of your historical data specifically for this purpose. This reserved data should remain untouched during the development and optimization process. If your strategy performs poorly when tested on this unseen data, it’s a strong sign of overfitting and could save you from costly errors in live trading.
But don’t stop there. Walk-forward analysis offers an even more dynamic way to test your strategy. This method involves optimizing your parameters on one segment of data, then testing them on the next period, and repeating this across your dataset. It mimics how your strategy would adjust to changing market conditions over time. Interestingly, 65% of institutional traders now rely on specialized software to conduct these in-depth stress tests.
Another powerful tool in your arsenal is Monte Carlo simulations. These simulations help you determine whether your strategy’s success stems from genuine market insights or sheer luck. By randomizing trade sequences, Monte Carlo simulations expose whether your strategy depends too much on a specific sequence of events. If it does, it likely won’t hold up in live trading. A 2014 study revealed that 44% of published trading strategies failed to replicate their backtested success on new data, largely due to inadequate validation.
"Overfitting happens when trading systems focus too much on historical noise instead of recognizing actual market patterns."
- Christopher Downie, Content & Product Strategist, LuxAlgo
Keep an eye out for red flags. For instance, if the Sharpe ratio or profit factor exceeds 3.0, it could indicate overfitted results rather than a true trading edge. Similarly, if your backtest shows a flawless equity curve but live trading results deteriorate quickly, your strategy may have memorized past data instead of identifying repeatable patterns. Testing with multiple methods isn’t about being overly cautious – it’s about ensuring your strategy is robust enough to handle real-world conditions when money is on the line.
5. Include Position Sizing and Risk Management in Optimization
One common mistake traders make is prioritizing entry and exit rules while treating risk management as an afterthought. This approach often leaves portfolios exposed to unnecessary risks. In fact, research shows that position sizing and asset allocation contribute to about 91% of portfolio performance variability. This makes them far more critical than many traders realize.
Risk management should be baked into your strategy from the start. For example, a Cardano (ADA) trading strategy saw its profit factor drop from 2.19 to 1.80 when volatility-based position sizing was removed. That seemingly small difference could mean the difference between steady profits and catastrophic losses.
"Amateurs focus on returns, professionals focus on risk."
- Erwanto, Gotrade
To manage risk effectively, translate your risk tolerance into precise position sizing. A simple formula to guide you is:
Position size = Maximum risk ÷ Stop-loss distance.
A widely accepted method is the "1% Rule", which advises risking no more than 1% of your total capital on any single trade [59, 61]. This rule provides a safety net: even after 14 consecutive losses, your capital would only be reduced by about 13%. Contrast this with risking 10% per trade – just 10 consecutive losses could completely wipe out your account.
Hard stop-loss and take-profit levels should also be part of your optimization process. Use technical analysis to determine these levels instead of choosing them arbitrarily. Incorporate volatility-adjusted sizing by setting stops at 2× the Average True Range (ATR) [65, 68]. In highly volatile markets, reduce your position sizes to limit risk. When volatility decreases, you can increase your positions since the risk is lower. Additionally, consider pausing trading or scaling back positions once your account hits a predetermined drawdown threshold.
The "3-5-7 Rule" is another practical guideline: risk no more than 3% per trade, limit overall portfolio exposure to 5%, and aim for at least 7% profit. This creates a risk-reward ratio of slightly over 2:1, which can keep your account profitable even with a win rate as low as 40%. Without these integrated risk controls, even the best trading strategy can falter.
6. Use Walk-Forward Testing to Validate Results
After solid backtesting, walk-forward testing takes validation a step further by simulating how your strategy would adapt to changing market conditions. Unlike traditional backtesting, which often reuses optimized data and risks overfitting, walk-forward testing re-optimizes parameters with new data at regular intervals, offering a more realistic evaluation of performance over time.
Here’s how it works: split your historical data into chunks. Use one segment (the in-sample data) to optimize your strategy, then test its performance on the next segment (the out-of-sample data). Slide these windows forward across the dataset, repeating the process until all data is covered. This rolling approach mirrors live market dynamics better than a single static backtest.
The concept of walk-forward analysis was first introduced by Robert E. Pardo in his 1992 book, Design, Testing and Optimization of Trading Systems. It has since become a widely respected method in trading strategy validation. By focusing on out-of-sample performance, this method helps identify overfitting – a common pitfall where strategies perform well on historical data but fail in real markets. For example, if a strategy consistently performs poorly in out-of-sample segments, it’s a sign that the strategy may be overly tailored to past market noise.
To measure the effectiveness of your strategy, use Walk-Forward Efficiency (WFE), which compares out-of-sample returns to in-sample returns. A WFE above 50% to 60% is generally a good indicator that your strategy has a reasonable chance of succeeding in live markets. Additionally, if your strategy’s optimal parameters – such as moving average lengths – vary significantly across windows, it may signal instability, reducing its reliability in real-world trading.
Selecting the right window sizes is crucial. Short windows can miss broader market cycles, while long windows may include outdated data that no longer reflects current trends. For intraday strategies, fixed rolling windows work well, whereas for longer-term strategies using weekly bars, anchored windows – where the start date remains constant – can be more effective. This flexibility in adjusting windows helps fine-tune your strategy, ensuring it’s better prepared for live deployment.
sbb-itb-e64548c
7. Measure Success Using Risk-Adjusted Metrics
When evaluating trading strategies, raw returns don’t tell the full story – they overlook the risks taken to achieve those returns. For instance, two strategies might both deliver 30% annual returns, but if one experiences a 50% drawdown while the other only dips by 10%, the difference is dramatic. Recovering from a 50% drawdown requires a 100% gain, whereas the 10% drawdown strategy maintains a much steadier trajectory. That’s why professional traders prioritize risk-adjusted metrics – these tools help determine whether profits stem from skill or excessive risk-taking.
To measure risk-adjusted performance, several key metrics come into play. The Sharpe Ratio evaluates excess return relative to volatility. A score above 0.75 suggests strong performance, while institutional-grade strategies often aim for 2.0 or higher. For strategies with uneven returns, like trend-following systems that rely on occasional large wins, the Sortino Ratio is more effective. It focuses solely on downside volatility, ignoring positive swings that boost performance. Another useful metric is the Calmar Ratio, which divides annual returns by maximum drawdown. Top-tier systems typically achieve ratios above 2.0.
"Risk-adjusted return metrics give you a performance truth serum, highlighting whether your profits come from precision, pain – or luck." – Mitch Zak, International Trading Institute
One of the most critical factors to monitor is maximum drawdown, as it directly influences a trader’s ability to stick with a strategy. Research shows that most traders abandon systems when drawdowns exceed 20-25%, regardless of past performance. Even a strategy yielding 30% annual returns can become untenable if it suffers a 70% drawdown, as traders often lose confidence and abandon it. Setting a maximum drawdown limit of 25% can help prevent this behavioral pitfall.
When comparing strategies, risk-adjusted metrics allow for meaningful, apples-to-apples evaluations. For example, a 10% return with 50% market exposure is more efficient than a 12% return with full exposure. Another useful measure is the Profit Factor, which compares gross profits to gross losses. A value above 1.75 signals a solid strategy, while anything over 4.0 may indicate over-optimization. By normalizing returns against risk, these metrics help identify strategies driven by real skill rather than mere luck during favorable market conditions. They serve as a foundation for assessing how well a strategy can withstand the pressures of real-world trading.
8. Use Platforms Like MillionMachine for Efficient Optimization

Manually optimizing trading strategies can be a grind. It’s slow, prone to mistakes, and often riddled with biases or data entry errors. That’s where dedicated platforms come in, automating the entire process and cutting down hours – or even weeks – of work into mere minutes. MillionMachine is one such platform, leveraging scalable cloud infrastructure to run thousands of backtests in no time.
What makes MillionMachine stand out? It simplifies strategy optimization with a visual design interface, so there’s no need for coding. Traders can describe their ideas using text or even voice commands, then verify rules directly on price charts. From there, it systematically tests parameter combinations, offering two powerful approaches: exhaustive optimization, which tests every possible scenario, and genetic algorithms, which mimic natural selection to zero in on the best options. This level of automation doesn’t just save time – it takes a robust backtesting foundation and rapidly identifies the most effective parameter ranges.
But optimization is just one piece of the puzzle. Validation is equally crucial, and MillionMachine has tools for that too. It includes overfitting detection with visual heatmaps that highlight parameter sensitivity. These heatmaps show how small changes in parameters can affect performance, helping traders spot potential curve-fitting issues before deploying a strategy. The platform also supports walk-forward optimization and out-of-sample testing, ensuring that strategies perform well on unseen data.
Another major advantage of using automated platforms? They take emotions out of the equation. Emotions like fear and greed can sabotage manual trading decisions, but automation eliminates these risks. In fact, roughly 60–75% of trades on U.S. stock exchanges are executed through automated systems. These systems operate on predefined rules and execute trades in milliseconds, ensuring consistency and efficiency. MillionMachine goes a step further by enabling traders to manage multiple asset classes simultaneously – a task that’s nearly impossible with manual workflows. Whether it’s stocks, futures, currencies, ETFs, or crypto, MillionMachine supports backtesting across all these markets, making it a one-stop shop for traders looking to diversify without juggling multiple tools. This seamless integration aligns perfectly with the broader strategies discussed earlier, offering a comprehensive and streamlined trading experience.
9. Track Live Performance and Make Careful Adjustments
When your strategy goes live, the real challenge begins. It’s not just about tracking profits – it’s about understanding what drives performance. Keep a close eye on key metrics like Profit Factor (aim for >1.75), Maximum Drawdown (keep it under 20%), and Sharpe Ratio (greater than 1.0). These numbers help you gauge whether your returns are worth the risk and if you’re effectively preserving your capital. Regular monitoring of these indicators allows for timely adjustments during live trading.
One critical point: significant drawdowns require disproportionately higher gains to recover. This is why it’s crucial to focus on drawdown depth rather than just raw returns. Use tools like the Ulcer Index to monitor slippage and drawdown duration. These metrics can reveal deviations from your backtested scenarios.
If you notice your metrics drifting away from out-of-sample (OOS) benchmarks, it’s time to reassess. Deviations from expected OOS performance often signal the need for a deeper review. Compare your live results to OOS benchmarks. If live metrics, such as CAGR or profit factor, remain close to OOS benchmarks, you’re likely seeing normal variation. However, if these metrics drop significantly or your drawdown exceeds predefined limits, consider it a red flag. To stay on top of things, schedule performance reviews: daily for execution checks, weekly for strategy consistency, and monthly for portfolio-level risk-adjusted returns.
"Even the best traders are wrong nearly half the time. This highlights the importance of managing losses and maximizing gains when trades go in your favor." – Steve Cohen
Stick to the 3-5-7 Rule: risk no more than 3% per trade, cap total exposure at 5%, and aim for at least 7% profit on your winning trades. Avoid making tweaks based on short-term fluctuations. If adjustments are necessary, implement them outside live trading hours and test them in a demo account first. Remember, the goal isn’t to achieve perfection – it’s about consistency and resisting the urge to tinker with a strategy during normal drawdown periods.
10. Test Across Multiple Markets and Asset Classes
After establishing solid backtesting and risk management practices, expanding your testing to include multiple markets can provide deeper insights into your strategy’s strength. For example, a strategy that works well with Gold but falls apart when applied to the S&P 500 might be overfitted to market noise rather than grounded in a true trading edge. Testing across various markets and asset classes helps distinguish strategies based on sound logic from those overly tailored to specific conditions. If your parameters remain effective across assets like stocks, futures, and currencies, you’re likely on the right track.
By testing in different markets, you also expose your strategy to a range of market conditions. This process ensures your approach can handle diverse scenarios. Diversifying across uncorrelated markets reduces the risk of experiencing simultaneous losses, which is particularly helpful during major shifts in market behavior – like moving from a bull market to a bear market or from trending conditions to a range-bound environment. Spreading your strategy across asset classes and sectors can help smooth out portfolio volatility, a key element in managing risk effectively.
To align with sound risk management principles, limit your total exposure to 5% of your capital when testing across markets. This precaution helps protect against correlated losses from simultaneous market movements. Incorporate walk-forward testing to verify that your parameters remain stable across various markets and timeframes. A strategy that performs consistently across different instruments and periods is better equipped to adapt to changing conditions.
Testing across market cycles also highlights your strategy’s durability. Tools like MillionMachine simplify this process by allowing you to backtest and optimize across five asset classes – stocks, futures, currencies, ETFs, and crypto – without requiring any coding. This multi-market validation complements earlier optimization efforts, creating a well-rounded approach to strategy development. It’s this type of testing that separates strategies with staying power from those that fail to deliver over time.
Comparison Table
Applying optimization best practices can significantly enhance performance, as shown in the table below. It highlights how key metrics shift when transitioning from a basic, unoptimized approach to one refined through proper techniques. These metrics demonstrate the value of using robust parameter zones, walk-forward testing, and risk-adjusted evaluations instead of merely chasing the highest historical returns.
| Metric | Before Optimization Best Practices | After Optimization Best Practices |
|---|---|---|
| Annualized Return (CAGR) | Lower and inconsistent, often missing high-probability opportunities | Higher and more stable, supported by robust parameter zones that adapt to market changes |
| Maximum Drawdown | High and unpredictable due to lack of risk controls or over-leveraging | Reduced through stable parameters and strict risk caps, such as limiting losses to 3% per trade |
| Sharpe Ratio | Low, reflecting poor risk-adjusted returns | Higher, indicating better returns relative to volatility |
| Trade Count | Either too low (statistically insignificant) or too high (overtrading with excessive fees) | Optimized for significance, typically exceeding 250 trades to ensure repeatability |
| Parameter Stability | Highly sensitive – small changes lead to large performance swings | Stable – strategy performs consistently across a range of similar input values |
Metrics like the Sharpe ratio and maximum drawdown are especially useful for gauging whether optimization has genuinely improved a strategy. A higher Sharpe ratio signifies better returns for the level of risk taken, while a lower maximum drawdown reflects stronger capital preservation during downturns. Trade count also matters – a strategy with at least 250 trades is generally considered statistically reliable, reducing the chance that results are mere flukes.
When analyzing optimization results, focus on parameter ranges where performance remains steady across similar values. Isolated peaks in performance can signal curve-fitting, which may not hold up in real-world conditions.
"An optimization is, in reality, a test of how robust your strategy is. When you examine the variables, you get a much better understanding of your strategy: is it due to chance/luck or might it be something worth trading?"
– Quantified Strategies
Always validate optimized parameters with out-of-sample data or walk-forward testing to confirm that improvements work in actual market conditions.
Conclusion
Improving your trading strategy is an ongoing process that involves backtesting, risk management, and fine-tuning parameters to achieve steady results. The 10 practices discussed earlier each play a crucial role in this cycle, from setting clear objectives and limits to using walk-forward testing and monitoring live performance. Together, these practices help ensure your strategy stays in step with changing market conditions.
With the extended trading hours now available on major U.S. exchanges, traders must be prepared to adapt their strategies to meet the demands of these evolving markets. While these longer hours open up new opportunities, they also require more resilient and responsive approaches. Automation and algorithmic trading can help reduce the impact of emotional decision-making and physical fatigue, especially during volatile or extended trading sessions.
The cornerstone of long-term success is disciplined testing and validation. By continuously refining your strategy, you can prepare it to handle future market changes rather than locking it into the patterns of past data. As Clayton Christensen aptly said:
"Most people think of strategy as an event, but that’s not the way the world works… the strategy that leads to success emerges through a process that’s at work 24/7 in almost every industry".
Combining technical and fundamental analysis with these practices can help you strike the right balance between seizing opportunities and minimizing risks. Evaluating success through risk-adjusted metrics – like the Sharpe ratio or maximum drawdown – rather than focusing solely on net profit ensures your strategy remains practical and sustainable over time.
Think of optimization as an ongoing journey, not a one-time fix. Approach it incrementally, validate every adjustment thoroughly, and stay responsive to market shifts. This disciplined process is key to building strategies that rely on statistical edges rather than luck or random outcomes.
Disclaimer: MillionMachine.com is a platform designed for research, education, and strategy development. It does not provide personalized investment, trading, or financial advice, nor does it solicit the purchase or sale of any financial instrument. MillionMachine does not offer recommendations or assess the suitability of any strategy, trade, or investment.
Users are solely responsible for their trading decisions and the risks involved. All simulations, backtests, and performance metrics provided by MillionMachine are hypothetical and should not be viewed as guarantees of future results. Hypothetical performance has inherent limitations and may differ significantly from actual trading outcomes.
MillionMachine is not registered as a Commodity Trading Advisor (CTA), Investment Advisor, or Broker-Dealer with the NFA, CFTC, SEC, or any other regulatory body. While the founder was previously registered as a CTA with the National Futures Association (NFA), that registration is no longer active, and MillionMachine does not engage in any regulated advisory activities.
MillionMachine does not execute trades, manage customer funds, or provide access to live trading accounts. Any integration with broker APIs is for user-controlled automation only, and users are responsible for ensuring compliance with all applicable laws, regulations, and broker requirements.
All market data, charts, signals, and analytics provided by MillionMachine are for informational and educational purposes only. MillionMachine does not guarantee the accuracy or completeness of this data and assumes no responsibility for errors, delays, or omissions.
Trading financial instruments – including futures, stocks, cryptocurrencies, and derivatives – carries substantial risk and may not suit all investors. Losses can exceed your initial investment. Past performance, whether real or simulated, is not a reliable indicator of future results.
FAQs
How can I avoid overfitting in my trading strategy?
To reduce the risk of overfitting, begin by dividing your data into distinct training and testing sets. This approach allows you to evaluate how your strategy performs on unseen data, giving you a clearer picture of its effectiveness. Keep your strategy simple by limiting the number of parameters, and avoid over-customizing it to historical data – doing so can hinder its ability to adapt to future market changes.
You can also apply techniques like walk-forward analysis, which tests your strategy across multiple time periods, and Monte Carlo simulations, which evaluate its behavior under various conditions. These methods help confirm that your strategy is resilient and not overly reliant on specific data patterns.
Why is risk management essential when optimizing a trading strategy?
Risk management plays a crucial role in shaping a successful trading strategy. It protects your trading capital while helping you stay in the game for the long haul. By keeping risks in check, traders can minimize losses, stay consistent, and handle market ups and downs with greater confidence.
Practical tools like position sizing, stop-loss orders, and maintaining a solid risk-reward ratio are essential for keeping potential losses under control. These methods not only shield your account but also promote steady progress, giving you the space to fine-tune and enhance your trading approach over time.
Why should trading strategies be tested in different markets?
Testing trading strategies across various markets is a smart way to ensure they work consistently and aren’t overly customized to a single set of conditions. Why? Because a strategy that only shines on historical data but falls apart in actual trading is likely suffering from overfitting.
By running strategies in different market environments, traders get a clearer picture of their stability and ability to handle diverse scenarios. This process not only boosts confidence in the strategy’s dependability but also helps identify any weak spots before putting it into action in live trading.

