
Overfitting ruins trading strategies. It happens when your strategy is too customized to past data, mistaking random noise for real patterns. This makes backtest results look great but leads to failure in live trading. Here’s how to prevent it:
- Split Your Data: Use separate in-sample (training) and out-of-sample (testing) data. Reserve at least 30% for testing to ensure your strategy works on unseen data.
- Simplify Rules: Avoid overcomplicating with too many parameters. Stick to logical, easy-to-explain strategies.
- Walk-Forward Optimization: Test your strategy across rolling time windows to check consistency.
- Monte Carlo Simulations: Test thousands of randomized scenarios to find weaknesses.
- Check Stability Metrics: Use Sharpe and Sortino ratios to measure risk-adjusted returns. Look for smooth, consistent performance across different conditions.
- Stress Test: Evaluate your strategy under varying market conditions to spot vulnerabilities.
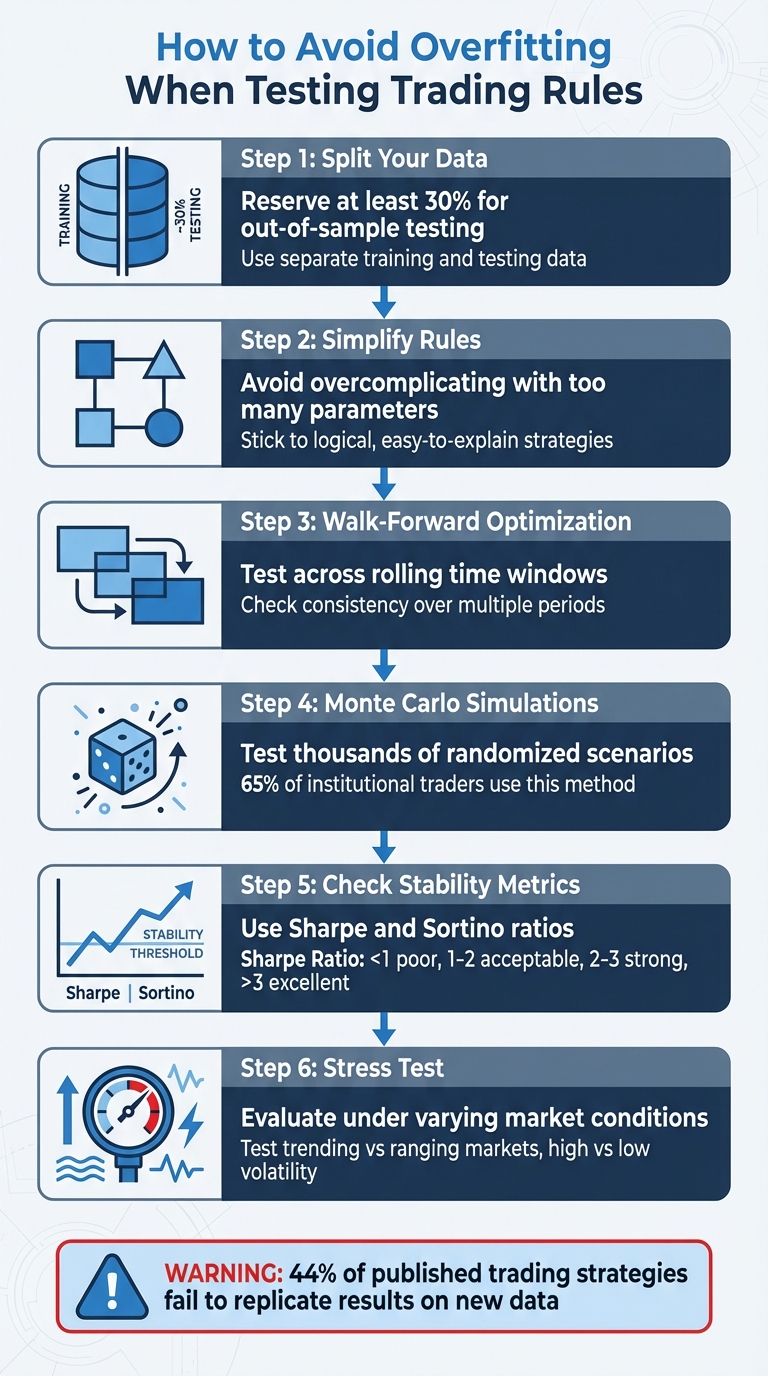
6-Step Process to Avoid Overfitting in Trading Strategies
Overfitting in Trading Strategies – How to Avoid It
What Is Overfitting in Trading Strategy Backtests?
Understanding overfitting is crucial to avoid the pitfalls that can undermine algorithmic trading strategies.
Definition of Overfitting in Trading
Overfitting happens when a trading strategy is overly tailored to historical data, picking up on random noise instead of actual market patterns. Instead of identifying meaningful trends, an overfitted model latches onto quirks in past data that are unlikely to repeat. Essentially, this means your system is "learning" the wrong lessons from the data. This issue ties into the bias-variance tradeoff: a high-variance strategy overreacts to noise, while a high-bias one might oversimplify and miss key trends.
Grasping this concept is the first step to spotting and addressing overfitting issues.
Signs Your Strategy Is Overfitted
There are several warning signs that a strategy may be overfitted. One of the most glaring is when backtests show unrealistically high performance. For instance, annualized returns in the thousands of percent, profit factors far beyond 1.5–2.0, or Sharpe ratios exceeding 3.0 should raise immediate suspicion. Another telltale sign is a large gap between in-sample and out-of-sample results. AQR Capital Management highlighted this problem when a moving average strategy’s Sharpe ratio dropped from 1.2 during backtesting to –0.2 when applied to new data.
Other red flags include extreme sensitivity to small parameter changes, inconsistent results across similar assets or timeframes, and overly smooth equity curves that rely on a few big wins rather than steady performance. These issues often point to flaws in how the strategy was developed.
What Causes Overfitting
Overfitting is often the result of excessive parameter tweaking. Traders may endlessly adjust variables – like moving average periods, stop-loss levels, or indicator thresholds – until the backtest looks perfect. However, this process can turn a straightforward strategy into an overly complex one that fits past data noise. As Quant Arb from The Quant Stack aptly said:
"If your reaction upon seeing an amazing backtest isn’t ‘ah man what broke’ then you haven’t seen enough of them to know better".
Other common culprits include data mining and biased data selection. Running countless backtests without accounting for randomness can lead to false positives. Add in issues like look-ahead bias (using future data in historical tests) or survivorship bias (ignoring delisted assets), and you may end up with a strategy that performs well in backtests but fails in real-world conditions. Interestingly, running more backtests often increases the gap between in-sample and out-of-sample performance.
These challenges highlight the need for careful strategy development, which will be explored further in later sections.
How to Reduce Overfitting Risk
Once you spot the signs of overfitting, the next step is to take action. Reducing overfitting involves careful data preparation, simplifying your strategy, and validating it rigorously before putting any real money on the line.
Split Your Data Correctly
The first step in avoiding overfitting is splitting your data properly. Divide your historical data into in-sample and out-of-sample sets. The in-sample data is used to develop and optimize your strategy, while the out-of-sample data stays untouched until you’re ready to validate your approach. Make sure at least 30% of your historical data is reserved for out-of-sample testing. This untouched data serves as a reality check – if your strategy works here, it’s more likely to succeed in live trading.
For instance, take the case of a trading robot named "Belinda." It was optimized using three variables – sma_short, sma_long, and atr_period – on data from April 1, 2014, to January 1, 2015. The backtest showed a profit of $3,549.18. However, when the same parameters were tested on out-of-sample data (January 1, 2015, to October 1, 2015), the strategy incurred significant losses. This illustrates how in-sample optimization can sometimes capture noise instead of genuine market patterns.
Keep Your Trading Rules Simple
Once you’ve split your data correctly, focus on simplifying your trading rules. Simpler strategies tend to be more robust and perform better across different market conditions. When you add too many variables – like tweaking moving averages, stop-loss levels, or indicator thresholds – you risk tailoring your strategy to random noise instead of meaningful trends.
Start with a solid market hypothesis that explains the observed patterns, rather than relying solely on backtesting results. Strategies grounded in sound economic reasoning are less likely to fall into the overfitting trap. If you can’t explain your strategy’s logic without referencing backtest data, it’s a red flag that your approach might be overfitted.
Use Walk-Forward Optimization
Another way to reduce overfitting is through dynamic testing, such as walk-forward optimization. This method is often seen as the "gold standard" for validating trading strategies. Instead of relying on a single train-test split, walk-forward optimization tests your strategy across multiple rolling time windows, ensuring it adapts to changing market conditions.
Here’s how it works: Optimize your parameters using a rolling in-sample window, then test them on the following out-of-sample segment. Repeat this process across all available data to evaluate consistency. For example, you might optimize a moving average strategy with the first three months of data to find an optimal 20-minute moving average, then test it on the fourth month. Next, optimize with months 2–4 and validate on month 5, continuing this pattern until all data has been covered. The performance across these validation periods gives you a clearer picture of your strategy’s true out-of-sample results.
As Quant Arb from The Quant Stack advises:
"Always keep some data spare that you haven’t tested on. Whether that’s some newer data, a load of other assets, ideally both even, and then right at the end you can validate on this and if it fails you’ve used it and you call it a day. You need some piece of data ideally that you don’t play around with until the end".
sbb-itb-e64548c
Testing Methods to Verify Strategy Reliability
Once you’ve minimized the risk of overfitting with proper data splits and straightforward rules, advanced testing methods can help confirm whether your strategy is solid and reveal any hidden flaws.
Monte Carlo Simulations
Monte Carlo simulations use historical data to create thousands of randomized trading scenarios. They shuffle trade sequences, adjust entry and exit timings, and factor in realistic slippage.
This method has become a staple in the trading world – 65% of institutional traders now rely on backtesting tools that include Monte Carlo simulations to refine their strategies. These simulations go beyond traditional backtesting by identifying potential weaknesses, helping you evaluate whether your strategy can hold up in scenarios outside the specific historical data it was built on.
Metrics That Measure Performance Stability
Profitability alone doesn’t tell the whole story. To gauge how stable your strategy is across different periods and conditions, you’ll need to rely on specific metrics:
- Sharpe Ratio: This measures risk-adjusted returns. A ratio below 1 is considered poor, 1–2 is acceptable, 2–3 is strong, and anything above 3 is excellent – though extremely high values might signal overfitting.
- Sortino Ratio: Focused on downside risk, this metric is especially helpful for those prioritizing capital preservation. Similar to the Sharpe ratio, values of 1–2 are acceptable, 2–3 are strong, and anything above 3 is exceptional.
Other key indicators include maximum drawdown and walk-forward analysis. A smooth profit curve across walk-forward windows suggests a reliable strategy, while a curve dominated by a few large spikes might hint at instability. If your largest trade far exceeds the average, it could mean your strategy leans too heavily on a few historical outliers rather than consistent performance. Interestingly, a 2014 study revealed that 44% of published trading strategies failed to replicate their results on new data.
In addition to these metrics, stress testing can further validate your strategy under changing market conditions.
Stress Testing Under Different Conditions
Stress testing builds on performance metrics by evaluating how your strategy handles shifts in market dynamics. For example, you can test it under various regimes, such as trending versus ranging markets, high versus low volatility, and across different asset classes. A strategy that thrives only in bull markets or calm conditions may struggle when the market shifts.
Another critical aspect is parameter sensitivity. If small tweaks – like changing a moving average from 20 to 22 periods – cause your strategy to swing from profit to loss, it lacks the robustness needed for long-term success. Stress testing helps ensure your strategy isn’t overly reliant on specific historical conditions, encouraging a more skeptical and realistic evaluation of its potential.
Step-by-Step Workflow Using MillionMachine

MillionMachine gives you the tools to design, test, and validate trading strategies – all without needing to write a single line of code. To get the most out of it, you need to follow a structured approach that minimizes the risk of overfitting right from the beginning.
Start With a Defined Trading Idea and Proper Data Setup
Before diving into MillionMachine, it’s crucial to have a well-thought-out hypothesis about market inefficiencies. Steer clear of basing your strategy on arbitrary indicator values or patterns that lack a connection to real market behavior. For instance, a strategy that leverages arbitrage opportunities between gold futures on different exchanges has a logical foundation. On the other hand, a rule that buys when the RSI hits exactly 32.7 is unlikely to hold up under scrutiny.
When preparing your data, split it into in-sample and out-of-sample segments. This ensures you have a clean way to validate your strategy later. Configure your data settings carefully to avoid lookahead bias – timestamps should align at the end of each bar, not the beginning. Once your data is ready, use MillionMachine’s visual builder to turn your hypothesis into clear, actionable trading rules.
Build and Test Your Trading Rules
With your hypothesis in mind, use the visual builder to create rules that are simple and rely on minimal parameters. Begin testing these rules on your in-sample data. The key here is to keep things straightforward – overly complex rules often lead to overfitting.
After setting up your initial strategy, validate it using the out-of-sample data. If your strategy performs well in-sample but fails during out-of-sample testing, it’s a sign that you’ve likely overfit to historical noise instead of identifying a genuine trading edge. To further refine your strategy, MillionMachine offers tools to run overfitting tests, ensuring your approach is ready for live trading.
Run Overfitting Tests and Analyze Results
To ensure your strategy can handle real-world conditions, MillionMachine provides Monte Carlo simulations and parameter optimization tools. These features help you stress-test your strategy by evaluating its sensitivity to small changes. For example, if altering a moving average from 20 to 22 periods turns a profitable strategy into a losing one, it’s a clear indication that the strategy lacks robustness.
When reviewing your performance reports, approach them critically. Look for a profit curve that remains smooth across different time periods, rather than one that depends on a few lucky trades. The ultimate goal is to create a strategy that performs reliably under varying market conditions – not one that only looks good when backtested against historical data.
Conclusion
Avoiding overfitting isn’t about achieving perfection; it’s about building strategies that can hold up under real-world conditions. The methods outlined here provide a solid roadmap: properly split your data, keep your rules straightforward, and validate your approach using robust testing techniques like Monte Carlo simulations and walk-forward analysis.
The key difference between a strategy that merely looks good on paper and one that performs well in live markets lies in the discipline of your testing process. By reserving a substantial portion of your data for out-of-sample validation, limiting the number of parameters, and stress-testing across various market scenarios, you can distinguish true trading opportunities from statistical noise. This approach aligns closely with the best practices used across the trading industry.
Tools like MillionMachine’s visual builder and testing platform make this process more accessible. They allow you to create strategies without needing to code, run simulations, and analyze detailed performance reports to determine if your strategy has a genuine edge or is simply overfitted. It’s worth noting that 65% of institutional traders now rely on specialized backtesting software to develop their strategies, underscoring the importance of rigorous testing for sustainable trading.
The process is clear: start with a well-defined market hypothesis, design simple rules, test them rigorously using multiple methods, and remain skeptical of overly optimistic results. While this approach can’t guarantee profits, it can help you avoid the costly pitfalls of deploying overfitted strategies in live trading. By following these steps, you’ll be better prepared to navigate the uncertainties of real-world markets.
MillionMachine.com is a platform designed for research, education, and strategy development only. Nothing on the site or within the software should be interpreted as personalized investment advice, financial guidance, or a solicitation to buy or sell any financial instruments. MillionMachine does not provide recommendations or assess the suitability of any trade, strategy, or investment.
Users are fully responsible for evaluating their own trading decisions and managing associated risks. All simulations, backtests, and performance metrics generated by MillionMachine are hypothetical and should not be considered guarantees of future results. Hypothetical performance has inherent limitations and does not reflect actual trading outcomes. Real-world results may differ significantly.
MillionMachine is not registered as a Commodity Trading Advisor (CTA), Investment Advisor, or Broker-Dealer with the NFA, CFTC, SEC, or any other regulatory body. While the founder was previously registered as a CTA with the National Futures Association (NFA), that registration is no longer active, and MillionMachine does not engage in regulated advisory activities.
MillionMachine does not execute trades, manage client funds, or provide access to live trading accounts. Any broker API integrations are solely for user-initiated automation, and users are responsible for ensuring their trading activities comply with all applicable laws, regulations, and broker requirements.
All market data, charts, signals, and analytics displayed by MillionMachine are intended for informational and educational purposes only. MillionMachine does not guarantee the accuracy or completeness of this data and assumes no responsibility for errors, delays, or omissions.
Trading in financial instruments – including stocks, futures, cryptocurrencies, and derivatives – carries significant risk and may not be suitable for all investors. Losses can exceed your initial investment. Past performance, whether simulated or actual, is not indicative of future results.
FAQs
How can I tell if my trading strategy is overfitted?
Overfitting in trading strategies often becomes evident when backtest results appear unusually strong but fail to deliver similar success in live markets or during out-of-sample testing. It can also manifest as a significant disparity between in-sample and out-of-sample performance, constant adjustments to parameters to match historical data, or models that are overly complex and seem to latch onto random market noise rather than genuine patterns.
To steer clear of overfitting, aim for strategies that are straightforward, reliable, and adaptable to various market conditions. Use validation methods like out-of-sample testing or Monte Carlo simulations to ensure your strategy holds up under different scenarios.
What is walk-forward optimization, and how can it help improve my trading strategy?
Walk-forward optimization is a method traders use to fine-tune strategies while reducing the chances of overfitting. The process involves splitting historical market data into sequential in-sample (training) and out-of-sample (testing) periods, helping ensure the strategy performs well on data it hasn’t seen before.
Here’s how to apply walk-forward optimization:
- Divide the data: Start by splitting your data into a training window, where you optimize parameters like moving averages or stop-loss levels, and a testing window, where you validate those results.
- Shift the windows: Move the training and testing windows forward (e.g., by three months), and repeat the optimization and validation process. Record key performance metrics, such as profit in U.S. dollars ($) and risk-adjusted returns, for each iteration.
- Assess the outcomes: Review the results from all testing periods. A strategy that performs consistently across these periods shows it’s robust, while significant variability may signal overfitting.
By continuously testing and refining, walk-forward optimization helps you develop strategies that identify genuine market patterns instead of just aligning with past data noise.
What is the role of Monte Carlo simulations in testing trading strategies?
Monte Carlo simulations are essential for assessing how well trading strategies hold up under various market conditions. By generating a broad spectrum of random market scenarios, these simulations provide insights into how a strategy might behave, even during unexpected market swings.
One of their standout advantages is spotting overfitting. They help determine whether a strategy’s performance is overly reliant on specific historical data or if it can handle a wider range of market environments. Including Monte Carlo simulations in your testing process helps refine strategies, making them more dependable before transitioning to live trading.

