
Optimizing your trading strategy parameters is key to improving performance and reducing risk. Here’s how you can do it in five practical steps:
- Define Your Strategy: Clearly outline your trading rules, including entry and exit points, risk limits, and key parameters like moving averages or RSI thresholds.
- Prepare Data: Use clean, accurate historical data for backtesting. Account for missing values, splits, dividends, and real trading costs like commissions and slippage.
- Run Optimization: Test parameter combinations using methods like grid search or genetic algorithms. Focus on metrics like Sharpe ratio, maximum drawdown, and trade frequency.
- Validate Results: Test optimized parameters on out-of-sample data and perform sensitivity analysis to ensure stability. Use Monte Carlo simulations to assess risk.
- Finalize and Monitor: Select stable parameters, track live performance, and re-optimize only if necessary.
Key Tip: Avoid overfitting by keeping strategies simple and validating them on unseen data. Tools like MillionMachine can streamline the process with automation and built-in testing frameworks.
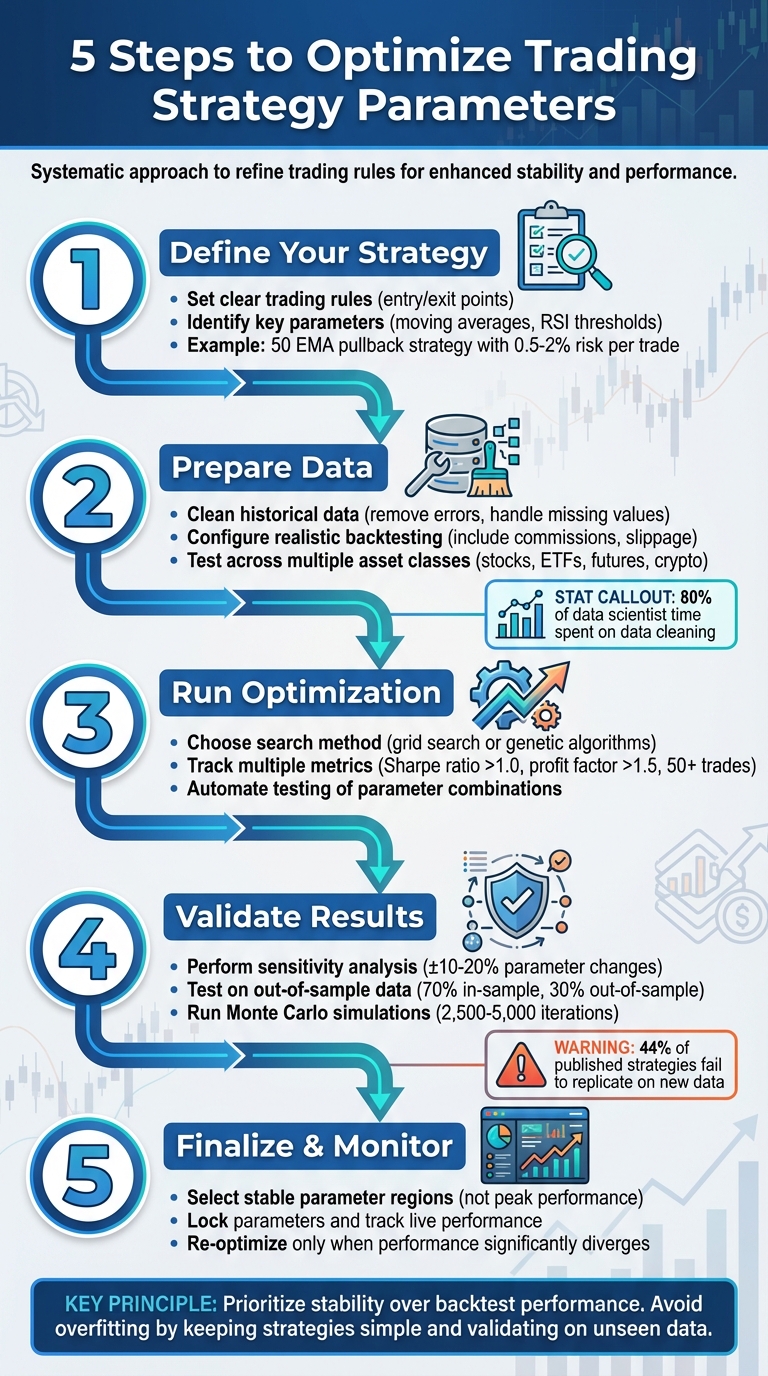
5-Step Trading Strategy Parameter Optimization Process
Step 1: Define Your Strategy and Select Parameters
Set Clear Trading Rules
Before diving into parameter adjustments, lay out a detailed, rule-based strategy. This means specifying exactly when to enter and exit trades, how much capital to risk, and where to place stop-losses and take-profits. Without these specifics, optimization becomes little more than guesswork. A well-defined set of rules is the backbone of any trading plan, ensuring decisions are consistent and measurable.
Start by setting clear, measurable goals. For instance, you might aim for a specific monthly return, limit losses per trade, or decide how many hours you’re willing to dedicate daily. Let’s say you’re using a pullback strategy: you could define the trend by spotting a price break above the 50 EMA, enter on a pullback near the 50 EMA, place a stop-loss just below the 50 EMA, and risk between 0.5% and 2% of your capital for each trade. This kind of structured, testable approach provides a solid foundation, unlike vague or abstract ideas.
Once your strategy is in place, the next step is identifying the key parameters that will drive its performance.
Choose Parameters to Optimize
With your rules established, focus on the parameters that have the most significant impact. These might include moving average periods, RSI thresholds, stop-loss percentages, or the percentage of equity risked per trade. For example, if you’re testing a moving average crossover strategy, you could experiment with the number of days in the moving average, ranging from 5 to 500 days, adjusting in 10-day increments. Using incremental ranges like this helps minimize the risk of overfitting. When working with dual moving averages, always ensure the short-term period is set shorter than the long-term period.
Use MillionMachine for Parameter Setup

After identifying the critical parameters, MillionMachine simplifies the setup and testing process. This platform allows you to configure your strategy visually, without needing to write code. You can describe your trading idea using voice or text, verify your rules directly on price charts, and select the parameters you want to optimize. MillionMachine handles the technical setup, so you can focus on refining the logic behind your strategy.
Once your parameters and rules are set, MillionMachine runs multiple permutations and tests them across different asset classes, including stocks, futures, currencies, ETFs, and cryptocurrencies. It then highlights the parameter combinations that deliver the best performance. This structured, data-driven approach ensures your optimization efforts are systematic rather than relying on random tweaks.
Step 2: Prepare Data and Set Up Backtesting
Clean and Verify Your Data
Once you’ve chosen your parameters, the next step is ensuring your data is accurate and your backtesting settings are realistic. Without high-quality data, your optimization results won’t hold up. Historical data needs to be precise, complete, and consistent; otherwise, your backtests could lead to flawed conclusions. In fact, poor data quality costs businesses an average of $15 million annually, and in trading, bad data often translates directly into financial losses.
Start by addressing common data issues like missing values, distortions from corporate actions (e.g., stock splits, dividends), time zone discrepancies, zero or negative prices, duplicate entries, and survivor bias [12,13,15]. For U.S. stock data from Yahoo Finance, always rely on the "Adjusted Close Price" column. This column accounts for splits and dividends, offering a total-return series that’s vital for accurate backtesting.
Handle missing data carefully. You can either impute missing values or remove incomplete rows, but never fabricate data – if no trading occurred, don’t create artificial values. Outliers should be managed using visual tools like scatter plots or statistical methods such as Z-scores [12,13,14]. Look for anomalies like sudden price jumps or gaps that don’t align with known market events, and cross-check your data against reliable sources. Automated checks can also help catch issues like missing dates, zero volumes, or negative prices [12,15].
Keep in mind, cleaning and organizing data often takes up over 80% of a data scientist’s time. While tedious, this step is essential for building a reliable dataset that will make your optimization efforts worthwhile.
Configure Realistic Backtesting Settings
A successful backtest depends on how closely your testing environment mimics real-world trading conditions. Ignoring factors like transaction costs, slippage, and execution delays can lead to overly optimistic results [19,20,22].
To ensure realism, set up your backtesting software to reflect your broker’s fee structure, including commissions, slippage, and other costs. Also, account for execution delays and latency. While backtests typically assume instant order fills, real trades often execute at slightly different prices, especially during volatile markets or when trading larger positions.
Test your strategy across a variety of market conditions – bull markets, bear markets, periods of low and high volatility, and sideways trends. For day trading strategies, 2-3 months of data is often sufficient. For strategies with longer timeframes, aim for 6-12 months of data to capture a broader range of market environments [19,20,21].
By incorporating these measures, you’ll create a solid foundation for validating your parameters. Once your settings are ready, you can expand your testing to include different asset classes.
Test Across Multiple Asset Classes with MillionMachine
Diversifying across asset classes is a smart way to manage risk and improve potential returns [27,29]. Testing your strategy on multiple markets helps reveal whether your parameters are genuinely effective or just tailored to a specific instrument. A diversified portfolio spanning bonds, commodities, forex, and equities not only preserves capital but also reduces the impact of sudden market shocks [26,27].
MillionMachine streamlines this process by offering a unified platform for multi-asset testing. After setting your parameters in Step 1, the platform automatically runs backtests across stocks, ETFs, futures, currencies, and cryptocurrencies, saving you the hassle of configuring each asset class separately.
This framework also allows you to compare portfolio-level risk against the risk of individual strategies, helping you develop parameter sets that perform well across a range of markets. This step is key to building strategies that are robust and adaptable to changing market conditions.
Step 3: Run Parameter Optimization
Select a Search Method
With clean data and realistic backtesting in place, the next step is to systematically find the best parameter values for your strategy. Two popular methods for this are grid search and genetic algorithms, each with its own strengths depending on your needs.
Grid search is straightforward: you define the ranges for your parameters and test every possible combination. For example, you could test fast periods between 5 and 20 and slow periods between 30 and 100. This method ensures you’ll find the best result within the range you’ve set, and it’s relatively easy to implement. Plus, it’s highly parallelizable, meaning you can run multiple tests at the same time to save time.
The downside? Grid search can get resource-heavy as the number of parameters and their ranges increase. For instance, testing five parameters with 10 possible values each means evaluating 100,000 combinations. That’s where genetic algorithms (GAs) come into play. Inspired by the principles of natural selection, GAs treat parameters as "genes" and create a population of random parameter sets. These sets are evaluated, and the best-performing ones are used to "breed" new combinations. This method is much more efficient for exploring large, complex parameter spaces, though it doesn’t guarantee finding the absolute best combination.
Here’s a tip to save time: start with a coarse grid search to identify general ranges where the best parameters might lie. Once you’ve narrowed it down, use a finer grid search to refine those values. This two-step approach is a smart way to reduce computational demands.
After choosing your search method, the next step is to define clear performance metrics to evaluate the effectiveness of each configuration.
Choose Performance Metrics
Relying on net profit alone to judge a strategy can be misleading. A strategy might show impressive returns but also come with significant risks, like large drawdowns or reliance on a few lucky trades. To properly assess your results, you need to track a variety of metrics that measure both profitability and risk.
Start with the Sharpe ratio, which evaluates risk-adjusted returns by dividing excess returns by volatility. Generally, a Sharpe ratio above 1.0 is acceptable, but if it exceeds 3.0, it could indicate overfitting. The Sortino ratio is another useful metric, as it focuses specifically on downside volatility, giving a clearer picture of harmful risks. Pay close attention to maximum drawdown, which shows the largest peak-to-trough decline your strategy experienced. For example, a 25% drawdown during backtesting could translate to 35–40% in live trading due to slippage and execution challenges.
Other metrics to consider include:
- Profit factor: This is the ratio of gross profit to gross loss. Aim for a value above 1.5.
- Trade frequency: A strategy should generate enough trades to be statistically significant – at least 50 trades is a good baseline.
- Win rate and risk-reward ratios: For example, mean reversion strategies may win over 70% of trades but have lower reward ratios, while trend-following strategies might win only 40% of the time but achieve risk-reward ratios of 3:1 or higher.
A real-world example underscores the importance of using multiple metrics. In February 2018, Adaptrade Software optimized 500 strategies for mini Russell 2000 futures. When net profit was the sole focus, the average in-sample profit was $48,865, but the out-of-sample profit dropped dramatically to $3,784. This highlights why it’s crucial to evaluate strategies using a composite quality score that combines several metrics, rather than relying on just one.
Once you’ve decided on your performance metrics, it’s time to automate the evaluation process for efficiency.
Automate Optimization with MillionMachine
Manually testing all possible parameter combinations is simply not practical. That’s where MillionMachine comes in – it automates the entire optimization process, letting you define parameter ranges and systematically test configurations across multiple asset classes.
Building on the setup from earlier steps, MillionMachine handles everything from running backtests to generating detailed reports for every permutation. Results are sorted based on your chosen metrics, whether that’s Sharpe ratio, maximum drawdown, or a combination of factors. The platform even includes overfitting tests using Monte Carlo simulations, which help you determine whether your optimized parameters are genuinely reliable or just tailored to historical data.
This automation not only saves you time but also minimizes human error. The reports clearly highlight the best configurations for each asset class, giving you a solid foundation for the next step: validation and stability testing to ensure your strategy performs well in real-world conditions.
Automate Trading Bot Parameter Optimization with Python: A Comprehensive Guide!
sbb-itb-e64548c
Step 4: Validate and Test for Stability
After optimizing your parameters, it’s time to ensure your strategy can hold up in unpredictable market conditions. This step is all about testing the stability and reliability of your approach.
Analyze Parameter Sensitivity
Once you’ve pinpointed your top-performing parameters, the next step is to check how stable they are. Sensitivity analysis helps with this by tweaking your optimized parameters slightly – say, by 10–20% in either direction – and observing how performance metrics like Compounded Annual Return (CAR) and Maximum Drawdown (MDD) respond. The goal is to find stable regions where small changes don’t lead to big drops in performance.
Cesar Alvarez from Alvarez Quant Trading emphasizes this point:
"Does changing a parameter slightly have a large change in the results? The focus should be on the statistics that one used to select the variations, which in my case were Compounded Annual Return (CAR) and Maximum Drawdown (MDD)."
In May 2017, Alvarez showcased this approach using a ConnorsRSI strategy. He ran 1,000 backtests where parameters were randomly adjusted – for instance, setting the 39-week high between 34 and 44 or tweaking the ConnorsRSI threshold by ±20%. In one test, the base CAR of 26.63% stood out as 2.40 standard deviations above the average CAR of 20.87%, hinting at overfitting. On the other hand, another variation showed a base CAR only 0.31 standard deviations above the average, suggesting better stability.
For reliable results, aim for your optimized CAR to fall within 1 standard deviation of the average from sensitivity tests. Anything between 1 and 2 standard deviations is a gray area, while values above 2 standard deviations could indicate instability. Tools like 3D surface graphs can help you visualize wide, stable performance plateaus rather than narrow, isolated peaks.
Once you’ve identified stable parameters, it’s time to test their reliability on unseen data.
Test on Out-of-Sample Data
Even if your parameters hold up in sensitivity analysis, you need to confirm they work on data the strategy hasn’t encountered before. Testing on out-of-sample (OOS) data helps guard against curve fitting and provides a clearer picture of how your strategy might perform in live trading.
A standard method is to divide your historical data into two parts: 70% for in-sample development and 30% for OOS validation. Once your strategy is finalized, test it on the untouched OOS data without making any further tweaks. If you adjust parameters based on these results, the OOS data essentially becomes in-sample data, which defeats the purpose of the test.
A large discrepancy between in-sample and OOS performance is a red flag for overfitting. To make your validation even stronger, choose an OOS period that includes a variety of market conditions – bull markets, bear markets, and periods of high volatility – rather than just a smooth, favorable time frame.
You can refine this process with walk-forward analysis, which involves repeatedly optimizing your strategy on one time period and then validating it on the next. This sequential method mimics real-time trading and reveals whether your strategy can adapt to shifting market conditions.
Once your strategy passes OOS testing, it’s time to dig deeper into its risk profile using simulations.
Run Monte Carlo Simulations
While backtesting shows how your strategy performed in one historical scenario, Monte Carlo simulations let you explore a broader range of possibilities. By randomly reshuffling historical returns, these simulations generate multiple equity curves, providing a more comprehensive view of potential outcomes.
Running 2,500 to 5,000 iterations can help you calculate critical risk metrics like Value at Risk (VaR) and Conditional VaR (CVaR). Tools like MillionMachine can automate these simulations, offering insights into profit probabilities, worst-case drawdowns, and whether your strategy’s success is statistically significant or just a lucky fluke.
Stable performance across simulations suggests your strategy is robust, while wide variations point to potential sensitivity in your parameters.
Step 5: Finalize and Monitor Parameters
With your strategy validated, it’s time to finalize the parameters and shift from backtesting to live trading. After confirming stability, lock in your chosen parameters and establish a system for tracking live performance.
Choose Final Parameters
When selecting your final parameters, focus on regions of stability rather than chasing the highest backtest profit. Traders often refer to this as finding a "parameter plateau" – a range where performance stays consistent even with small tweaks. A helpful method for identifying these stable regions is Combinatorial Cross-Validation (CCV). This process involves creating multiple train-test splits, optimizing parameters for each split, and clustering the results to highlight stable areas.
To ensure reliability, evaluate parameters that consistently perform well across sensitivity analyses and out-of-sample tests. Don’t just rely on net profit; consider a mix of metrics like Compounded Annual Return (CAR), market exposure time, and maximum drawdown. For instance, if your optimal moving average is 163 days, check if nearby values (e.g., 140 to 180 days) also deliver strong results. This consistency is a sign you’re working within a stable region.
Lock Parameters and Track Performance
Once you’ve chosen your parameters, lock them in and avoid making further changes. The real test begins when you compare live trading results to your backtest projections. Use tracking platforms like FX Blue or MyFxBook to monitor your live account. Export your results as CSV files to directly compare them with backtest data. Tools like MillionMachine’s analytics can simplify bulk comparisons between live and backtest performance. This ongoing tracking allows you to spot deviations and make informed adjustments if needed.
Schedule Re-Optimization
Re-optimize your parameters only when live performance significantly diverges from backtest results. Avoid re-optimizing on a fixed schedule. Strategies built on extensive historical data and designed to adapt to changing volatility may rarely need adjustments. In fact, some experienced traders opt never to re-optimize once they’ve identified robust parameters. Frequent re-optimization increases the risk of curve fitting, which can harm long-term performance.
MillionMachine.com is a research and strategy development tool designed for educational purposes. Nothing on the site or platform constitutes personalized investment advice, trading guidance, or a solicitation to buy or sell financial instruments. MillionMachine does not make recommendations or assess the suitability of any strategy or investment.
Users are solely responsible for evaluating their trading decisions and risks. All simulations, backtests, and analytics generated by MillionMachine are hypothetical and are not guarantees of future results. Hypothetical performance has inherent limitations and does not reflect actual trading outcomes. Real-world results may differ significantly.
MillionMachine is not registered as a Commodity Trading Advisor (CTA), Investment Advisor, or Broker-Dealer with the NFA, CFTC, SEC, or any other regulatory body. While the founder was once registered as a CTA with the National Futures Association (NFA), that registration is no longer active, and MillionMachine does not engage in regulated advisory activities.
MillionMachine does not execute trades, manage customer funds, or provide access to real-time trading accounts. Any integrations with broker APIs are solely for user-initiated and controlled automation. Users are fully responsible for ensuring compliance with applicable laws, regulations, and broker requirements.
All market data, charts, and analytics provided by MillionMachine are for informational and educational purposes only. The platform does not verify the accuracy or completeness of market data and assumes no responsibility for errors, delays, or omissions.
Trading financial instruments – including futures, stocks, cryptocurrencies, and derivatives – carries significant risks and may not be suitable for all investors. Losses can exceed your initial investment. Past performance, whether actual or simulated, does not guarantee future results.
Common Mistakes and How to Prevent Them
Even the most carefully optimized strategies can stumble into common pitfalls. A 2014 study revealed that 44% of published trading strategies failed to replicate their success when tested on new data. By understanding these challenges, you can craft strategies that perform reliably in live markets, not just in backtests. Below are some practical ways to address these issues and build more dependable strategies.
Prevent Overfitting
Overfitting occurs when a strategy becomes too tailored to past data, capturing random noise instead of meaningful market signals. The result? A strategy that shines in backtests but falls apart in real trading. Common causes include excessive tweaking of parameters, selecting biased datasets, and making the strategy overly complex. To avoid this, focus on simplicity and consistency.
- Keep it simple: Limit the number of parameters and indicators in your strategy.
- Group testing: Test parameters in small, related groups with narrow value ranges instead of running exhaustive combinations.
- Validate thoroughly: Use walk-forward analysis to test parameters on unseen data during optimization.
Tools like MillionMachine’s built-in overfitting tests, such as Monte Carlo simulations, can help you measure and mitigate the risk. Additionally, metrics like the Probability of Backtest Overfitting (PBO) and Deflated Sharpe Ratio (DSR) provide objective insights into whether your strategy is over-optimized.
Include Real Trading Costs
Backtest results can be misleading if you ignore real-world trading costs like commissions, slippage, and market impact. These costs might seem minor but can erode profits, especially for high-frequency strategies. Always configure your backtesting environment with realistic cost assumptions that reflect your broker’s fees and typical market conditions.
- Factor in slippage: Include realistic estimates, particularly for market orders or trades executed during volatile periods.
- Match conditions: Use accurate trading cost settings in your simulations to ensure your backtest mirrors live trading conditions.
MillionMachine makes it easy to input these variables, helping you align your backtest with the realities of live markets.
Avoid Data Snooping
Data snooping happens when you repeatedly test strategies on the same historical data, eventually identifying patterns that seem profitable but are actually random. This bias often goes unnoticed in backtests, leading to unreliable strategies. The key to avoiding this trap is strict data separation.
- Set aside data: Reserve a portion of your historical data exclusively for final validation and avoid using it during strategy development.
- Use walk-forward analysis: Continuously move your testing window forward in time to simulate real-world conditions.
- Test in demo accounts: Before committing real money, run strategies in demo accounts for several months. This incubation period can reveal flaws that historical testing might overlook.
Conclusion
Fine-tuning trading strategy parameters is all about striking the right balance between improving performance and ensuring stability. The five-step process – defining your strategy, preparing data, running optimization, validating results, and monitoring performance – offers a clear roadmap for refining your approach while avoiding common pitfalls like overfitting or data snooping. The aim isn’t to chase after the highest backtest returns but to develop strategies that can hold up across different market conditions.
Optimization is not a one-and-done task; it’s an ongoing effort. While optimization can refine a strategy, it’s important to remember that no amount of tweaking can guarantee future success. Markets change, and continuous monitoring paired with periodic adjustments is essential. Techniques like walk-forward analysis and out-of-sample testing are invaluable for identifying strategies that are truly solid versus those that merely perform well on historical data.
MillionMachine simplifies this process by enabling you to visually design strategies, optimize parameters across various asset classes, and test for overfitting with tools like Monte Carlo simulations. This allows you to focus on improving your trading logic and managing risk effectively.
The bottom line? Prioritize stability over flashy performance. A strategy that delivers steady, moderate returns with low volatility is far more likely to succeed in live trading than one that boasts impressive backtest results but falters in real-world conditions. By following these five steps and leveraging the right tools, you can craft strategies that are better equipped to handle the unpredictability of live markets.
Disclaimer: MillionMachine.com is a platform designed for research, education, and strategy development. It does not offer personalized investment, trading, or financial advice, nor does it solicit the purchase or sale of any financial instruments. MillionMachine does not provide recommendations or guidance on the suitability of any strategy, trade, or investment.
Users are solely responsible for their own trading decisions and risk assessments. All simulations, backtests, and performance metrics generated by MillionMachine are hypothetical and carry inherent limitations. They do not reflect actual trading results, and real-world outcomes may differ significantly.
MillionMachine is not registered as a Commodity Trading Advisor (CTA), Investment Advisor, or Broker-Dealer with the NFA, CFTC, SEC, or any other regulatory body. While the founder was previously registered as a CTA with the National Futures Association (NFA), that registration is no longer active, and the platform does not engage in regulated advisory activities.
MillionMachine does not execute trades, manage customer funds, or provide access to live trading accounts. Any integration with broker APIs is strictly for user-initiated, user-controlled automation. Users are fully responsible for ensuring their trading activities comply with all relevant laws, regulations, and broker requirements.
All market data, charts, signals, and analytics provided by MillionMachine are intended for informational and educational purposes only. MillionMachine does not verify the accuracy or completeness of market data and assumes no responsibility for any errors, delays, or omissions.
Trading financial instruments – including futures, stocks, cryptocurrencies, and derivatives – carries substantial risk and may not be suitable for all investors. Losses can exceed your initial investment. Past performance, whether actual or simulated, is not indicative of future results.
FAQs
How can I prevent overfitting when optimizing my trading strategy?
To avoid overfitting, aim to keep your strategy as straightforward as possible. Using too many parameters or overly intricate models might make your strategy excel in backtests but fail when applied to actual market conditions.
Test your strategy with fresh, unseen data to confirm it can perform beyond the dataset it was trained on. Consider using advanced evaluation methods like walk-forward analysis or Monte Carlo simulations. These techniques examine how your strategy might hold up under various scenarios, helping to assess its reliability and minimize the risk of overfitting.
Lastly, stick to realistic assumptions and resist the urge to over-optimize your strategy to match historical data. Striking the right balance ensures your strategy remains dependable and practical for live trading.
What are the best practices for validating optimized trading strategy parameters?
To effectively validate trading parameters, start with backtesting. This involves using historical data to evaluate how your strategy would have performed under different market scenarios. Next, move on to paper trading, where you test the strategy in a simulated, real-time environment without putting actual money at risk. Finally, transition to real-time testing by trading small positions in live markets to see how the strategy behaves in actual conditions.
Pay close attention to critical performance metrics like the win rate, risk-to-reward ratio, and maximum drawdowns. To ensure your strategy is reliable and not overly tailored to past data, employ methods like cross-validation and stress testing. Factor in realistic trading costs such as commissions and slippage to mimic real market conditions. Keep a detailed record of your trades and use the insights gained to refine and improve your strategy over time.
What are the best performance metrics to evaluate a trading strategy?
When assessing a trading strategy, it’s essential to look at metrics that paint a complete picture of its performance. Here are some key ones to consider:
- Profit Factor: This compares gross profits to gross losses, giving you a sense of the strategy’s overall profitability.
- Maximum Drawdown: This metric shows the largest drop from a peak to a trough, helping you gauge the level of risk involved.
- Sharpe Ratio: By evaluating risk-adjusted returns, this ratio reveals how efficiently the strategy generates profits relative to the risks taken.
- Win Rate: This percentage reflects how often trades are profitable, offering insight into the strategy’s consistency.
- Expectancy: This calculates the average profit or loss per trade, providing a clearer view of the strategy’s reliability over time.
By examining these metrics together, you can gain a deeper understanding of how the strategy performs in terms of profitability, risk, and consistency. This approach allows for a more comprehensive and informed evaluation.


Dave R. on March 13, 2026
You’re spot on about parameter optimization being critical – I wasted months chasing the perfect settings on single EAs before realizing the real issue was trying to use one bot across all market conditions. I’ve been testing Ratio X Toolbox on MT5 and the whole concept clicked for me: having separate bots for trending, ranging, breakout, and gold scenarios means you’re actually optimizing for the regime you’re in, not fighting drawdown from a one-size-fits-all approach. Have you found that tuning parameters works better when you’re matching the EA to the actual market condition, or do you still optimize for everything at once?
Dave R. on May 18, 2026
Yeah, this hits home. I’ve burned through so many single-bot setups that blow up in the first market regime shift, and you’re spot on about stress testing being the missing piece. After three years of chasing the “perfect EA,” I switched to Ratio X Toolbox specifically because it has different bots for trending, ranging, and breakout scenarios – which directly addresses what you’re talking about with optimizing parameters for reliability. The point about factoring in realistic slippage and commissions is crucial too, and that’s where most backtests fail. Have you found that stress testing across multiple market conditions actually lowered your drawdown, or is it more about avoiding the catastrophic blowups?